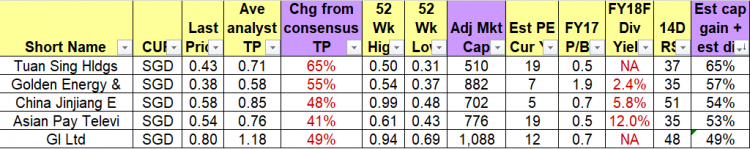
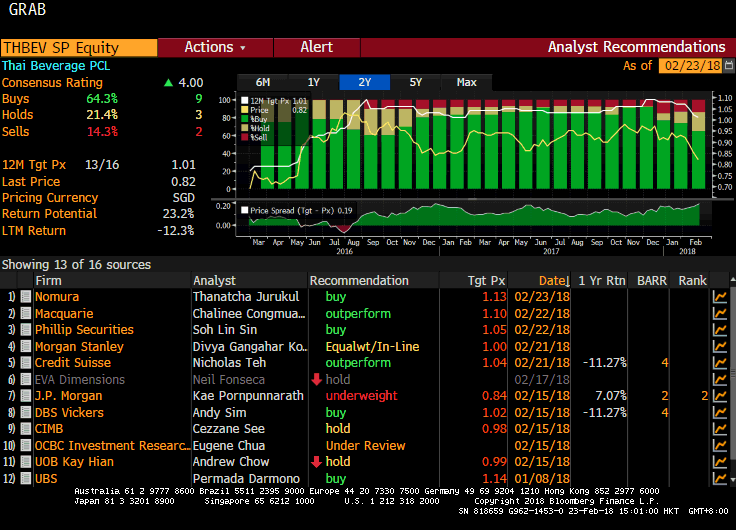
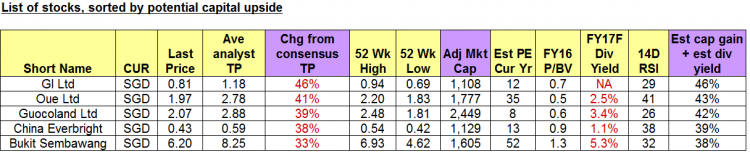
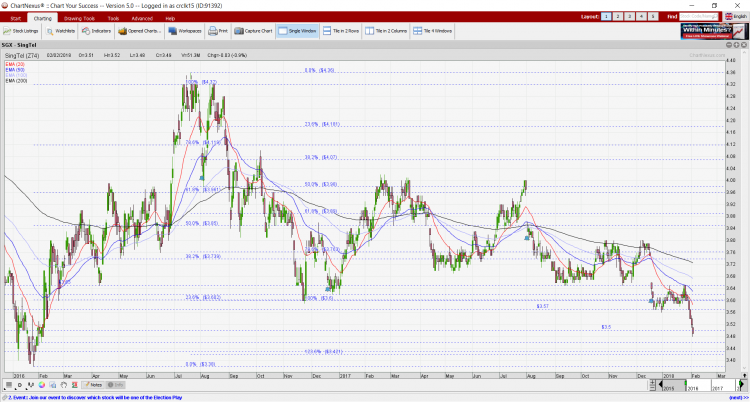
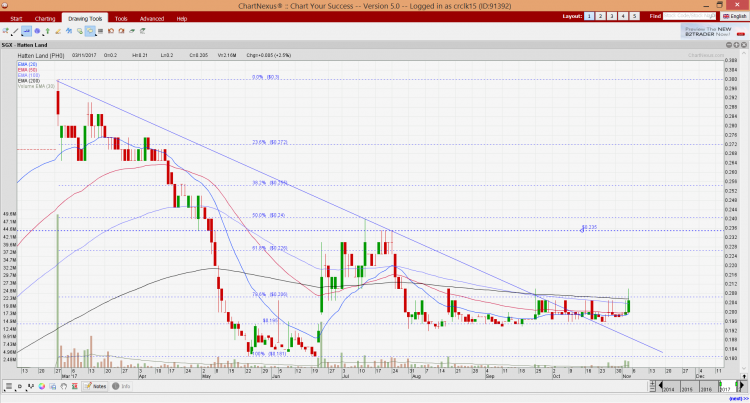
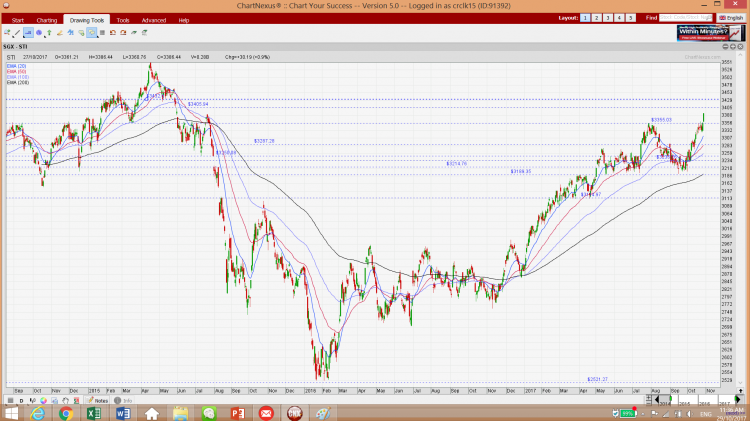
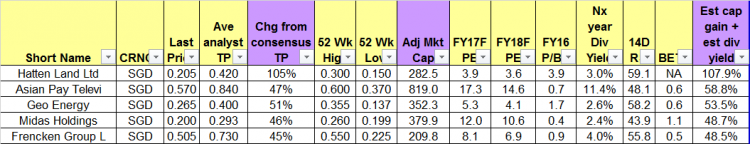
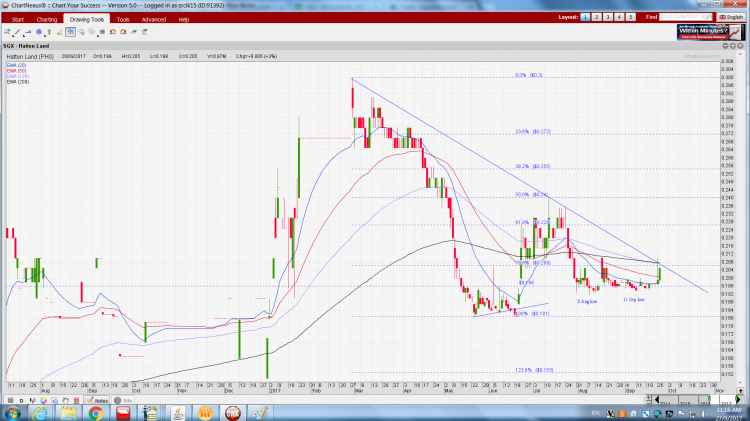
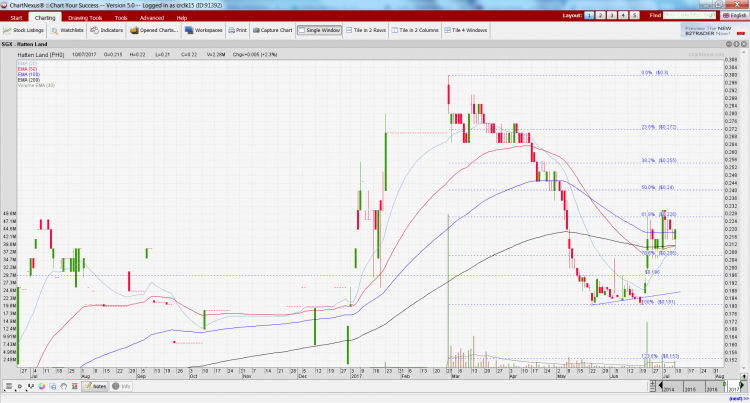
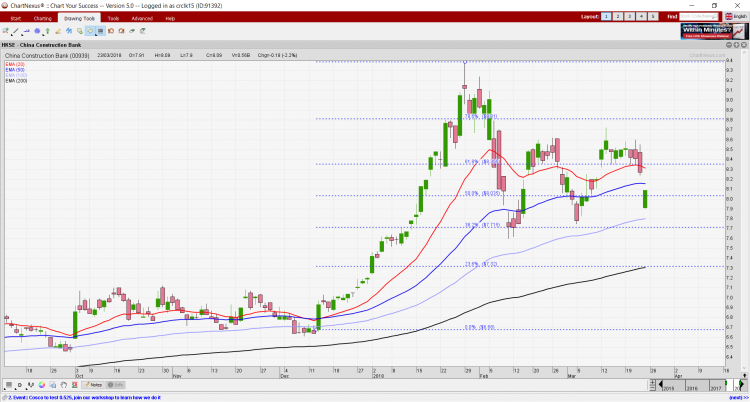
HK listed China banks to report results this week – potential trading opportunities? (23 Mar 18)

With reference to my earlier write-up (click HERE), besides SGX listed stocks, clients and readers can consider to take a look at some of the China banks listed on HK stock exchange. They may be interesting due to their upcoming results which may present some potential trading opportunities, especially when some of them have fallen 13-14% from their recent highs on 29 Jan 2018.   Why do I choose HK listed China banks, instead of our local banks for potential trading opportunities? 1. On a macro picture, Hang Seng seems to be slightly stronger than STI based on chart. For […]

S&P500 – closed below its 200D EMA – a 1st since Nov 2016! (23 Mar 18)

Dear all, Previously, I mentioned in my write-up dated 21 Mar that I am avoiding the event risk of the U.S. tariff package against Chinese (click HERE). This proves timely as S&P500 fell 129 points, or 4.7% from 2,717 on 20 Mar to close 2,588 on 23 Mar. At 2,588, S&P500 has made its first close below its 200D exponential moving average (“EMA”) since Nov 2016. Why and how is this significant?  During the sharp 10% drop in the first part of Feb 2018, S&P500 has not closed below its 200D EMA. Furthermore, most technical analysts are watching this level […]

ThaiBev drops to almost a two-year low. Will it go lower? (23 Feb 18)

ThaiBev has dropped 12% from an intraday high of $0.920 on 14 Feb 2018 (before the results) to trade at $0.810 on 23 Feb 2018. At $0.810, this was the lowest last seen on 13 May 2016. Will it go lower?   Chart analysis Based on Chart 1 below, ThaiBev is entrenched in a strong downtrend with all the exponential moving averages (EMAs) moving lower, coupled with death cross formations. The breakdown at $0.895 points to an eventual measured technical target of $0.805 which is attained today. Since its result release on 14 Feb after market, the volume of shares […]

Global indices have tumbled 6% since their recent high. Will they go lower? (7 Feb 18)

Dear all, With reference to my earlier write-up citing that “Volatility in the market is among the lowest in 118 years…” (click HERE), I guess the old saying is still true. i.e. “Be careful of what one wishes for”, especially in the equity markets! Global indices have recently tumbled at least 6% since their recent high. Will markets fall further?   S&P500 closed at 2,682 S&P500 has swung from an intraday high of 2,873 on 26 Jan 2018 to touch an intraday low of 2,593 on 6 Feb 2018. 20D and 50D exponential moving averages (“EMAs”) are turning downwards. Other […]

Singtel nears two-year lows, will it go lower? (2 Feb 18)

Dear all Singtel has breached below $3.50 on increased volume last Fri. This is significant as it has not closed below $3.50 since 4 Feb 2016. Volume has picked up significantly with the drop. Will Singtel go lower?   Singtel’s chart analysis Singtel has breached below its trading range $3.57 – 3.65 established between 18 Dec 2017 – 30 Jan 2018 on 31 Jan 2018. Volume has accompanied the fall by surging for the past four days and the volume of shares transacted for the past three days hit a daily volume of 49 – 51m shares per day. This […]

2 companies to watch out as markets reach new highs (3 Nov 17)

Based on yesterday’s close, Nasdaq clocked a 63rd record close for 2017 and overtook the previous 62 record closes for 1980! S&P500, Nasdaq and Dow registered their 25th record close for 2017 simultaneously, matching the record established in 1995. On our local front, STI approaches a more than two year high. 2017 has not ended yet. For those investors who have not invested much, are they too late to the party? Are there still stocks with scope for potential upside? Personally, I believe that there are two companies, namely Hatten Land (“Hatten”) and GSS Energy (“GSS”) with interesting charts and […]

Ernest’s market opinion (27 Oct 17)

Dear all STI has closed at 3,386, a fresh 29-month high. Some of you who have been less than 30% invested in their portfolios and have not added more exposure in their equities portfolio last month are wondering whether you have missed out of the rally. Should you continue to chase this? Read on for more.   S&P500 last closed 2,581 S&P500 is on a strong uptrend with all the exponential moving average (“EMA”) trending higher. ADX closed at 29.3, amid positively placed DIs, indicative of a trend. RSI closed at 70.7. This is not extremely overbought, relative to past […]

Ernest’s compilation of stocks sorted by estimated total potential return (29 Sep 17)

Dear all S&P500 hit another record last Fri! Some private banking clients have enquired on any interesting stocks to take a closer look with a horizon of 1-3 years. Therefore, I have compiled a list of stocks based on Bloomberg’s data as of 29 Sep 2017. Table 1 shows only the top five stocks with the highest estimated total potential return. Table 1: List of top 5 stocks with the highest estimated total potential return Source: Bloomberg as of 29 Sep 2017   Noteworthy points 1. This compilation is based on Bloomberg’s data sorted with my set of criteria namely, a) […]

Hatten Land – poised to breach above $0.210 (26 Sep 17)

Hatten Land (“Hatten”) has been trading in a tight range $0.192 – 0.210 for the past two months. Recently, there seems to be a pick up in the volume traded for the past two days. Hatten’s chart looks positive on several fronts.   Chart analysis Based on Chart 1 below, odds seem high that Hatten may be poised to breach above $0.210 in the next couple of months. This is because a) The recent price increase (albeit mild price increase) is accompanied with volume. On the days which Hatten falls, it is accompanied with lower than average volume; b) A […]

Hatten Land – chart looks positive on several fronts! (10 Jul 17)

Pursuant to my previous write-up on 23 May 2017 (click HERE for the earlier write-up) citing the oversold nature on Hatten’s chart, Hatten has surged 20.2% from $0.183 on 23 May 2017 to close $0.220 on 10 Jul 2017. Hatten’s chart looks positive on several fronts.   Chart analysis Based on Chart 1 below, Hatten’s chart seems to have several positives. a) It is evident that the recent price increase is accompanied with volume. On the days which Hatten falls, it is accompanied with lower than average volume; b) A double bottom formation seems to have formed with the neckline breakout […]