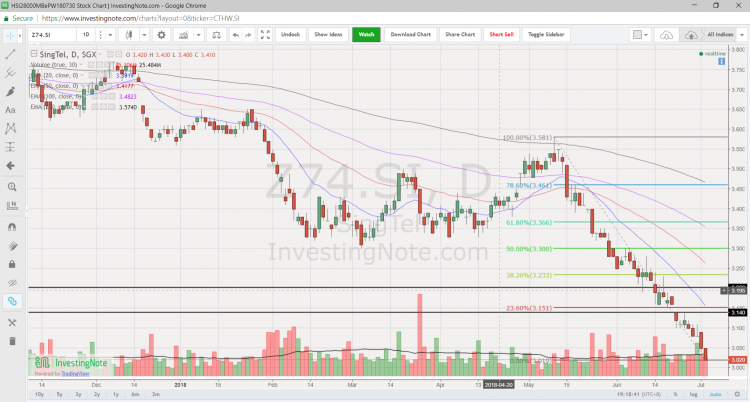
Singtel hits multi-year low and all time oversold since 2000! (3 Jul 2018)

Singtel closed -$0.03 to $3.02, the lowest close since Jun 2012. Based on Bloomberg, it is trading at approximately 5.9% estimated div yield. Ave analyst target is around $3.92. Hence total potential upside is around 35.7%. What has happened to Singtel which hit multi-year lows despite analysts’ buy calls? Is this a buying opportunity? Or is it a falling knife?   Singtel – takeaways from some analyst reports The recent weakness in Singtel may be attributed to its challenging industry, especially when the industry faces new entrants in both Singapore and Australia. Although Singtel may lack near term catalysts, based […]

EC World Reit – potential strong growth ahead (29 Jun 18)

Dear all, Reits are clearly not in our investors’ favour as evidenced by the 10.2% fall in FTSE Reit index (FSTAS8670.IN), which closed 786 on 29 Jun 2018, after hitting a multi-year high of 875 in Jan 2018. Most analysts or strategists will recommend reits with distribution per unit (“DPU”) growth, so as to combat the rise in interest rates. EC World Reit (“EC”) may be one with DPU growth. I have the privilege of meeting Mr Goh Toh Sim, Executive Director & CEO of EC and Mr Li Jinbo, Head of Investment of EC (“Management”) for a 1-1 discussion […]

STI – down 9.4% since 2 May. Correction coming, or buying opportunity? (19 Jun 18)

With reference to my market outlook HERE posted on 11 May 2018, I mentioned at that time that I  have started to sell into strength, as I am cautious on the overall market. I updated on 30 May 2018 (click HERE) that STI is likely to trade sideways with downward bias. Separately, my clients would have been notified on 12 Jun 2018 morning that I have already reduced my percentage invested to approximately 40% as I believe market is likely to trend downwards in the next couple of weeks. In the span of four trading days, STI has dropped 148 […]

STI slumps 198 points after hitting a decade high of 3,642 on 2 May! (30 May 18)

With reference to my market outlook HERE posted on 11 May 2018, I mentioned at that time that I have started to sell into strength, as I am cautious on the overall market. Clients would have been aware / notified that I have already reduced my percentage invested to <60% early last week. STI has since dropped 126 points from 3,570 on 11 May 2018 to close 3,444 on 30 May 2018. For those who wish to accumulate on weakness, I have compiled a list of stocks here, using Bloomberg’s data as of 30 May 2018. The criteria for compilation […]

STI notched a ten year high on 2 May – is it a screaming buy for all SG stocks (11 May 18)

Dear all, Dow has logged a seventh consecutive rise and small caps as measured by S&P600 index have just closed at a record high as of 11 May 2018. Our Singapore market has also done us proud too by becoming Asia’s best performing equity market on 2 May 2018. In view of the above, is it a screaming buy for our Singapore market, especially our small caps which have under-performed? Let’s take a closer look at the charts and my personal action plan.   S&P500 closed 2,728. Day range 2,717 – 2,733 Based on Chart 1 below, S&P500 seems to […]

Sunningdale trades at 8.3x FY18F PE; 0.66x P/BV and 5.5% FY18F div yield (30 Apr 18)

Sunningdale has plunged 46% in less than half a year, from an intraday high of $2.40 on 6 Nov 2017 to close $1.30 on 30 Apr 2018. What happened? Is Sunningdale a “goner”?   Some reasons for Sunningdale’s decline Sunningdale’s share price decline may be attributed to some of the reasons below: a) Sentiment on tech sector has soured Sentiment has soured on the tech sector primarily due to downbeat results or / and guidance from tech companies such as Taiwan Semiconductor Manufacturing Co. Ltd, SK Hynix. Secondly, there are rising fears of increasing regulation measures on the tech sector. […]

Venture approaches bear territory! Should we sell? (24 Apr 18)

Dear all, Venture has entered into bear territory after dropping 21% from an intraday high of $29.65 on 13 Apr 2018 to close $23.40 on 24 Apr 2018. What should we do? Let’s examine the chart and some noteworthy points on Venture.   Chart analysis Based on Chart 1 below, Venture’s chart seems to resemble a bearish double top formation. The break below its neckline $26.95 points to an eventual technical measured target $24.60 which is already attained today. 20D, 50D and 100D exponential moving averages (“EMA”) have started to turn lower amid the sharp drop. Venture closed below its […]

Oxley – poised to benefit from Singapore’s property market upturn (10 Apr 18)

Dear all, Do you know that Oxley has the largest residential land bank in Singapore by number of dwelling units, based on an article in the Business times dated 23 Jan 2018? Based on a flash estimate from the Urban Redevelopment Authority, Singapore private home property prices jumped 3.1% in the three months to Mar 2018. This was the fastest since 2010. Notwithstanding such buoyant sentiment in home prices, Oxley’s share price has recently dropped to near six month low levels. Thus, I think it may be worthwhile to take a look at Oxley.   First, a description of Oxley […]

Island reversal; potential Dow Theory sell signal… What does this mean for our markets? (30 Mar 18)

Dear all, Besides the headline grabbing news on Facebook and the U.S. China trade tariffs etc. some of you may have noticed other equally interesting / alarming headlines such as the island reversal chart formation seen in Nasdaq 100 (click HERE) and Nasdaq Composite index, and reports that a potential “Dow Theory” sell signal, one of the oldest and arguably the most widely followed market timing tool, may happen anytime (click HERE). What should we do? Let’s take a closer look at the charts and my personal action plan.   S&P500 closed 2,640. Day range 2,610 – 2,659 Based on […]

DBS – potential trading idea going to XD (26 Mar 18)

Dear all, Based on a simple tracking of DBS’ share price performance from CD to XD, on average, DBS seems to move approximately 4-9% above its CD price, nearer to XD (translating to around S$27.86-29.13). See Table 1 below. DBS is going to XD $1.10 on 3 May. Table 1: DBS’ share price performance from CD to XD Source: Ernest’s compilations   What are the analysts saying? Based on Figure 1 below, average analyst target is around $31.15. At $27.21, this represents a potential capital upside of around 14.5%. Estimated div yield is around 4.1%. There are 17 buy; 6 […]