Recent weakness provides accumulation opportunities (9 Sep 20)

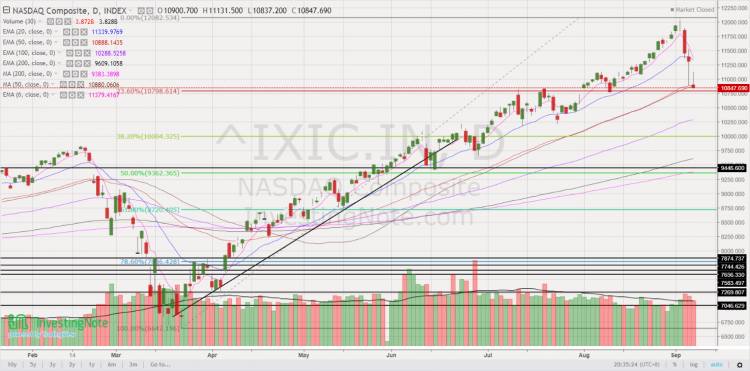
Dear all Based on Table 1 below, U.S. indices have fallen between 5.5% – 10% from the close of 2 Sep to 8 Sep. Nasdaq led the decline with a 10% drop. These are interesting times indeed! Why do I say so? Read on below. Table 1: Performance of various indices from 2 Sep to *8 Sep 20 Source: Ernest’s compilations (*STI and Hang Seng are based on 9 Sep closing prices) In my personal opinion, this recent U.S. market weakness provides accumulation opportunities for the well prepared and for those who have been waiting on the side-lines to accumulate […]
Stocks sorted by total potential return (7 Sep 2020)

Dear all U.S. markets have fallen sharply with Nasdaq dropping almost 1,200 points or 10% from an intraday high of 12,074 on 2 Sep to an intraday low of 10,876 last Fri. For example, Apple Inc. has lost $219b in market cap from the close of 1 Sep through 3 Sep which is larger than the market cap of Exxon Mobil Corp., for long the world’s largest company! In view of the recent decline, some clients have asked me which are the stocks that they can look at. Below is my compilation of the top ten stocks and the bottom […]

STI – to head towards 3,390 points in 1Q2020? (25 Dec 19)

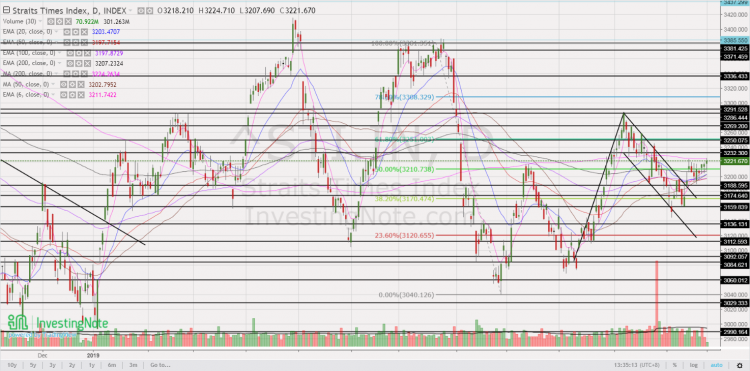
Merry Xmas! As we approach end 2019, most market strategists are putting their market estimates for end 2020. Although I do not profess to be in the league of these market strategists, just for fun, I am expecting STI to head towards 3,390 in 1Q2020. STI closed at 3,222 on 24 Dec 2019. I have outlined my basis and the risks involved.   Factors for my bullish basis a) Chart looks positive after bullish break Based on Chart 1 below, STI has staged a bullish break above its flag formation on 12 Dec 2019. Notwithstanding below average volume for the […]

Chasen – a bullish double bottom making in the making? (23 Oct 19)

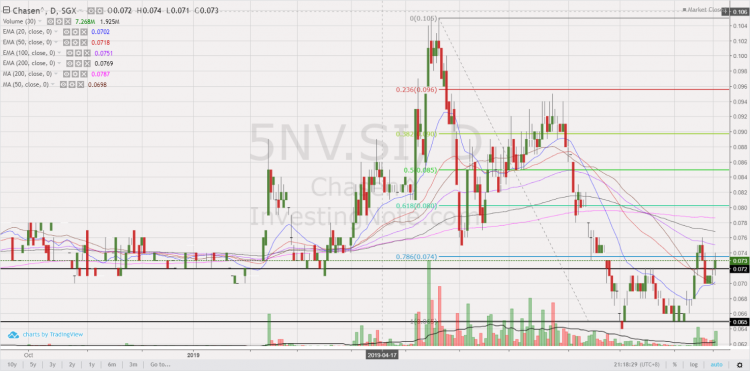
Dear all, This week, Chasen catches my attention as it seems to be forming a bullish double bottom on its chart. I have appended my personal chart analysis, together with some potential positive and negative points on the company. Read on for more below.   Chasen’s chart analysis Based on my personal interpretation of Chasen’s chart, it seems to have tested its double bottom neckline around $0.070-0.072 for the past few days. For the past two days, it managed to close higher consecutively with above average volume. In fact, Chasen closed today with 7.3m shares changing hands, 3.8x above its […]

Halliburton trades at 9-year low price, amid 10-year low valuations (17 Jun 19)

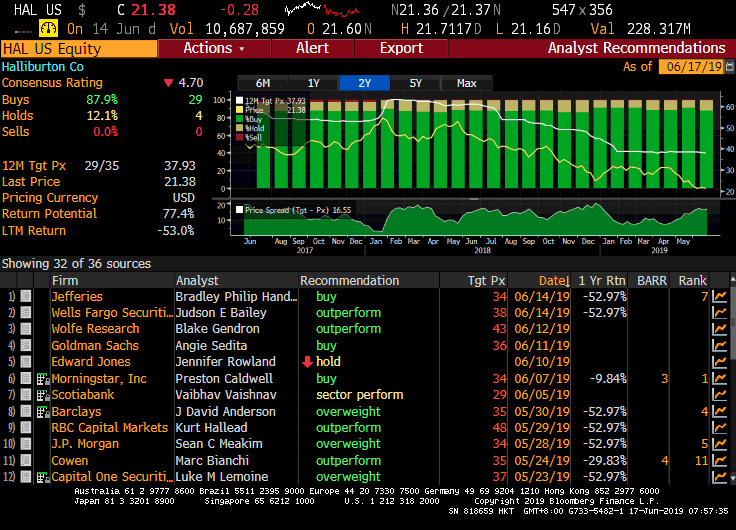
Dear all This week, Halliburton (“HAL”) caught my attention as it closed at US$21.38 on 14 Jun 2019, lowest since 1 Jun 2010 and 7 Aug 2009, amid 10-year low valuations. Given the basis below, my personal view is that HAL may be presenting a favourable risk reward setup for a long trade.   Potential basis to long a)  At US$21.38, this is the lowest close since 1 Jun 2010. At 12.5x current PE and 1.9x P/BV (see Figure 1 below), these valuations seem attractive as compared to its 10Y average PE and P/BV 29.3x and 3.2x respectively; Figure 1: […]

ISOTeam – on the verge of a bullish break from a potential double bottom formation! (21 May 2019)

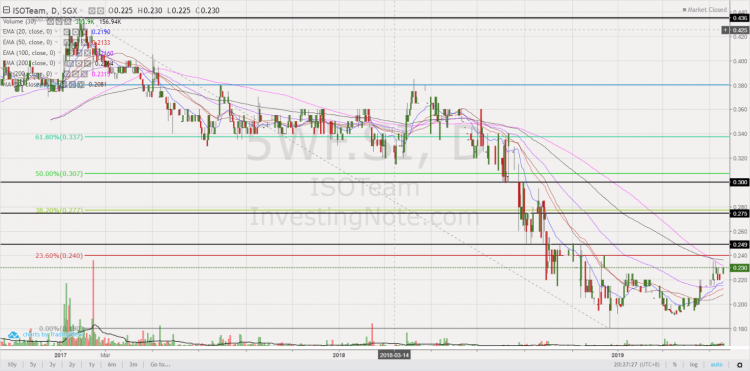
Previously, I have done a write-up (click HERE) on ISOTeam (“ISO”) after interviewing Anthony, CEO and Richard, GM on an exclusive basis in Dec 2018. I have bought in at that time and have taken profit in Jan 2019. Since Apr, I have been accumulating ISO, as its chart seems to portend a potential upside breakout after a lengthy potential double bottom formation. ISO closed at $0.230 on 21 May 2019. Let’s take a look at its investment merits and more importantly, its investment risks below.   Investment merits a) Potential bullish break from a double bottom formation Since 2017, […]

Two interesting stock charts – Best World and Tencent (12 Oct 18)

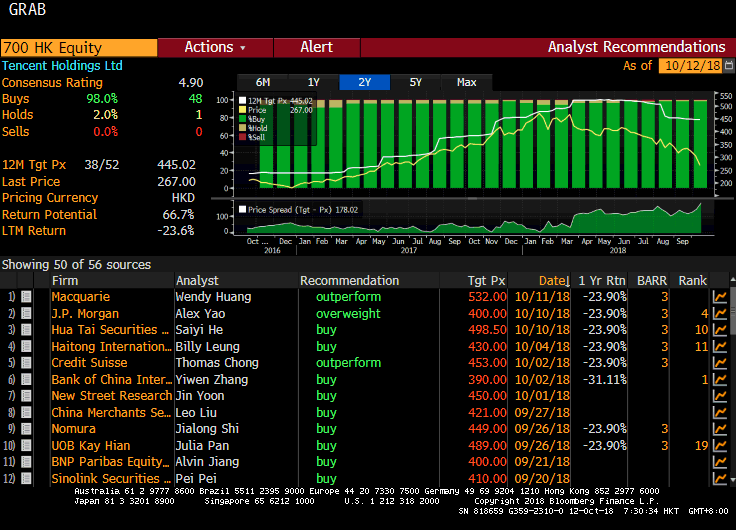
Notwithstanding the sea of red in the equity markets for the past couple of days, these two stock charts caught my attention. They are Best World and Tencent.   Best World – retreats back to double bottom neckline Best World has dropped 9.2% from an intra-day high of $1.52 on 4 Oct 2018 to close $1.38 on 11 Oct 2018. Based on Chart 1 below, Best World is retreating back to its double bottom neckline of around $1.39. This seems to be a classic “break and re-test” resistance turned support pattern. There is a confluence of supports (50D, 100D and […]

Best World – potential bullish double bottom formation in the making? (19 Sep 18)

This week, Best World has caught my attention. Why is it interesting? a) Chart seems to be in the midst of a double bottom formation Best World has fallen 29% from an intraday high of $1.90 on 19 Mar 2018 to close $1.35 on 19 Sep 2018. It has been trading in a range $1.20 – 1.39 since 15 May 2018. Indicators are mixed with MACD and RSI exhibiting bullish divergences during this period. Except for 200D EMA which is levelling, all other EMAs are rising. 20D has already formed a golden cross formation with 50D EMA. Best World has […]

Hatten Land – chart looks positive on several fronts! (10 Jul 17)

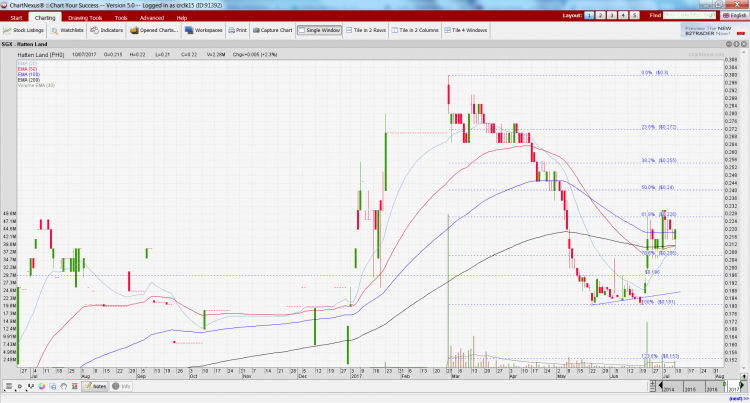
Pursuant to my previous write-up on 23 May 2017 (click HERE for the earlier write-up) citing the oversold nature on Hatten’s chart, Hatten has surged 20.2% from $0.183 on 23 May 2017 to close $0.220 on 10 Jul 2017. Hatten’s chart looks positive on several fronts.   Chart analysis Based on Chart 1 below, Hatten’s chart seems to have several positives. a) It is evident that the recent price increase is accompanied with volume. On the days which Hatten falls, it is accompanied with lower than average volume; b) A double bottom formation seems to have formed with the neckline breakout […]

Capital world has tumbled 46% since 29 Mar 17. What gives? Will it fall further? (1 Jun 17)

Capital World (formerly known as Terratech Group Limited) has slumped a whopping 46% from its intraday high of $0.240 on 29 Mar 2017 to close $0.130 on 1 Jun 2017. What has happened to cause such a massive fall? Will it fall further?   Company description Capital World is an innovative property developer that works with landowners on a joint venture basis to create value added property developments. Such joint venture requires minimal capital outlay and maximises investment returns. It is currently developing Project Capital City, an integrated property project comprising a retail mall, hotel and serviced suites and serviced […]