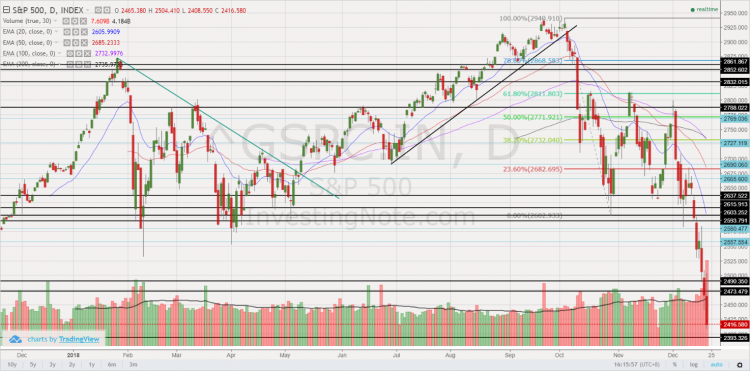
S&P500 logged its largest one day fall since Jan. Buy more, or head to the exit? (27 Mar 2019)

Dear readers, Last Fri, S&P500 logged its largest one day fall since 3 Jan 2019, due in part to the weak European PMI and the yield curve inversion between U.S. 3-month bill and 10-year note yields. At the time of writing this, Dow closed 0.55% higher on Tues as U.S. 10 year bond yields stabilise. Is last Fri’s fall the precursor to something more serious? Or it is a false alarm?   First things first, what are the reasons for the sharp rally since late Dec? S&P500 has rallied approximately 20.1%, or 471 points from the intra-day low of 2,347 […]

Hong Fok hits 10-year overbought level and up 12 out of 13 trading days! (19 Mar 19)

This week, Hong Fok catches my attention this week because a) It has risen approximately 33% in 12 out of the past 13 trading days from an intraday low of $0.685 on 28 Feb 2019 to close $0.910 today. It is noteworthy the 13th day is at an unchanged level. In other words, Hong Fok has not had a down day since 28 Feb 2019; b) At $0.910, this is near its 25 Oct 2015 high of around $0.91-0.920. The previous high which is higher than $0.920 occurred in Sep 2014. I.e. Hong Fok is trading near a four plus […]

Hi-P – Chart looks interesting with rising ADX, amid positively placed DI (21 Feb 19)

This week, Hi-P caught my attention due to its chart. It last trades at $0.990. Day range 0.985 – 1.00. Let’s take a look. Basis below 1.Chart looks interesting with rising ADX, amid positively placed DI Hi-P has been trading in a tight range $0.885 – 0.960 since 8 Jan 2019 and broke out with strong volume on 11 Feb 2019. ADX has been rising to trade 31.6 amid positively placed DI, indicative of a trend. RSI last trades 57.9. Today is T+8 of 11 Feb upmove. There has been some price weakness on 15 & 18 Feb as I […]

Sing Medical – Chart seems to be strengthening (13 Feb 2019)

This week, Sing Medical’s (“SMG”) caught my attention. At the time of writing this write-up, SMG is trading +0.005 to $0.430. Day range 0.425 – 0.430.   Some interesting observations on SMG a) Chart seems to be strengthening Based on Chart 1 below, SMG seems to have breached the near term downtrend line established since Mar 2018. Today is T+7 of the sharp upmove dated 31 Jan 2019 thus, I guess those contra players (who plan to contra and not hold the stock) have already exited. Indicators such as OBV, RSI and MACD are strengthening. ADX last trades 34.5 on […]

S&P500 has slumped 13.7% in Dec, largest percentage fall since 1931! Has the bull market ended? (23 Dec 18)

Dear all After hitting an intra-day high of 2,941 on 21 Sep 2018, S&P500 has tumbled 17.9% or 525 points to close 2,416 on 21 Dec 2018. In fact, S&P500 has just logged the worst monthly performance in Dec since 1931! Dow has also fallen 3,535 points from the intraday high of 25,980 on 3 Dec 2018 and 4,507 points from the intraday high of 26,952 on 3 Oct 2018. What is happening? Is Armageddon coming?   Most things have not changed since 21 Sep, except for… In Sep, when S&P500 hit 2,940, the usual concerns were also there, namely […]

Sunpower – price action & bullish divergence warrant a closer look (20 Dec 18)

Dear readers, Some of you have sent me emails to express concerns whether I am still maintaining my blog, as I have not posted an article in the past couple of months. Thanks for the concern and emails. It warms my heart that there are readers who are actively following my blog. Something happened to my family which caused me unable to post articles on a timely basis. (My clients are still receiving some periodic short writeups on the market and specific companies during this period) Anyway, I am glad to be back to work this week! This week, Sunpower’s […]

Sunpower slips into bear market territory – Buying opportunity or falling knife? (24 Oct 18)

This week, Sunpower attracts me due partly to the industry which it is in; the recent US$180m investments made by DCP and CDH into Sunpower whose market cap is only around US$206m, and the considerable 40% share price decline since hitting an intra-day high of $0.645 on 28 Jun 2018 to trade $0.385 today. Let’s take a look.   Description of Sunpower Based on Sunpower’s description, it is an environmental protection solutions specialist in proprietary energy saving and clean power technologies. It has two main business segments, viz. Manufacturing & Services (“M&S”) and Green Investments (“GI”). M&S segment comprise of […]

Two interesting stock charts – Best World and Tencent (12 Oct 18)

Notwithstanding the sea of red in the equity markets for the past couple of days, these two stock charts caught my attention. They are Best World and Tencent.   Best World – retreats back to double bottom neckline Best World has dropped 9.2% from an intra-day high of $1.52 on 4 Oct 2018 to close $1.38 on 11 Oct 2018. Based on Chart 1 below, Best World is retreating back to its double bottom neckline of around $1.39. This seems to be a classic “break and re-test” resistance turned support pattern. There is a confluence of supports (50D, 100D and […]

Best World – potential bullish double bottom formation in the making? (19 Sep 18)

This week, Best World has caught my attention. Why is it interesting? a) Chart seems to be in the midst of a double bottom formation Best World has fallen 29% from an intraday high of $1.90 on 19 Mar 2018 to close $1.35 on 19 Sep 2018. It has been trading in a range $1.20 – 1.39 since 15 May 2018. Indicators are mixed with MACD and RSI exhibiting bullish divergences during this period. Except for 200D EMA which is levelling, all other EMAs are rising. 20D has already formed a golden cross formation with 50D EMA. Best World has […]