STI has dropped almost 17% since 2 May! Is a bear market coming? (14 Oct 18)

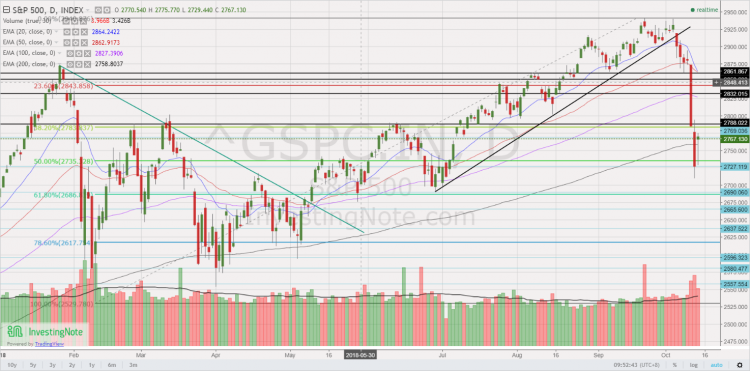
Dear all, U.S. equity markets have logged their worst weekly performance in the past six months. For our local market, STI has dropped 16.7% from an intra-day high of 3,642 on 2 May 2018 to an intra-day low of 3,035 on 11 Oct 2018. It closed at 3,069 on 12 Oct 2018. Is a bear market coming? There are mixed views. Bears are saying that we have not reached the bottom yet. Some perma-bears are even saying this may be the start of the bear market. Bulls are saying that this represents a window of opportunity to accumulate stocks on […]

Two interesting stock charts – Best World and Tencent (12 Oct 18)

Notwithstanding the sea of red in the equity markets for the past couple of days, these two stock charts caught my attention. They are Best World and Tencent.   Best World – retreats back to double bottom neckline Best World has dropped 9.2% from an intra-day high of $1.52 on 4 Oct 2018 to close $1.38 on 11 Oct 2018. Based on Chart 1 below, Best World is retreating back to its double bottom neckline of around $1.39. This seems to be a classic “break and re-test” resistance turned support pattern. There is a confluence of supports (50D, 100D and […]

Sing Medical trades near one year low despite a 70% jump in 1HFY18 net profit! (3 Oct 2018)

This week, Sing Medical (“SMG”) caught my attention. SMG has dropped 39% from $0.725 on 18 Jul 2017 to trade $0.440 on 3 Oct 2018. My personal guess is part of the fall may be attributable to a) Lower, or no earnings growth for some of the healthcare players in FY18F. However, this is likely not the case for SMG, as analysts believe SMG is on track for a minimum 40% growth in FY18F net profit. It is noteworthy that SMG already posted a 70% jump in 1HFY18 net profit; b) Reduction in the general PE valuations ascribed to the […]

Best World – potential bullish double bottom formation in the making? (19 Sep 18)

This week, Best World has caught my attention. Why is it interesting? a) Chart seems to be in the midst of a double bottom formation Best World has fallen 29% from an intraday high of $1.90 on 19 Mar 2018 to close $1.35 on 19 Sep 2018. It has been trading in a range $1.20 – 1.39 since 15 May 2018. Indicators are mixed with MACD and RSI exhibiting bullish divergences during this period. Except for 200D EMA which is levelling, all other EMAs are rising. 20D has already formed a golden cross formation with 50D EMA. Best World has […]

Yangzijiang – 2nd worst performing STI stock with -40% YTD (6 Aug 2018)

Yangzijiang (“YZJ”) has been the 2nd worst performing STI stock with -40% year to date (“YTD”) return based on the closing price of $0.880 on 6 Aug 2018 (click HERE). In the past four days, YZJ has weakened approximately 9.3% after hitting the intraday high of $0.970 on 31 Jul 2018. Is this recent share price decline the harbinger of poor results to be released on 7 Aug, after market?   2QFY18 results unlikely to be poor Based on my personal view, 2QFY18F results are unlikely to be poor based on the following points: a) Number of vessels delivered Based […]

Moya’s major shareholders raise stake (13 Jul 2018)

On 6 Jul and 9 Jul, there were separate announcements on SGX that Tamaris Infrastructure (Salim controlled vehicle and major shareholder) and Gateway have raised their stake in Moya. What is so interesting about this?   Proposed rights at $0.095 at no discount On 22 May 2018, Moya announced that it is proposing renounceable non-underwritten rights issue to raise funds for a) Finance its Build, Operate and Transfer projects; b) Loan repayment; c) Potential acquisition   There are three main interesting aspects on this rights issue, namely: 1.The rights were issued at no discount Typically, when a company issues rights, […]

Singtel hits multi-year low and all time oversold since 2000! (3 Jul 2018)

Singtel closed -$0.03 to $3.02, the lowest close since Jun 2012. Based on Bloomberg, it is trading at approximately 5.9% estimated div yield. Ave analyst target is around $3.92. Hence total potential upside is around 35.7%. What has happened to Singtel which hit multi-year lows despite analysts’ buy calls? Is this a buying opportunity? Or is it a falling knife?   Singtel – takeaways from some analyst reports The recent weakness in Singtel may be attributed to its challenging industry, especially when the industry faces new entrants in both Singapore and Australia. Although Singtel may lack near term catalysts, based […]

EC World Reit – potential strong growth ahead (29 Jun 18)

Dear all, Reits are clearly not in our investors’ favour as evidenced by the 10.2% fall in FTSE Reit index (FSTAS8670.IN), which closed 786 on 29 Jun 2018, after hitting a multi-year high of 875 in Jan 2018. Most analysts or strategists will recommend reits with distribution per unit (“DPU”) growth, so as to combat the rise in interest rates. EC World Reit (“EC”) may be one with DPU growth. I have the privilege of meeting Mr Goh Toh Sim, Executive Director & CEO of EC and Mr Li Jinbo, Head of Investment of EC (“Management”) for a 1-1 discussion […]

Venture approaches bear territory! Should we sell? (24 Apr 18)

Dear all, Venture has entered into bear territory after dropping 21% from an intraday high of $29.65 on 13 Apr 2018 to close $23.40 on 24 Apr 2018. What should we do? Let’s examine the chart and some noteworthy points on Venture.   Chart analysis Based on Chart 1 below, Venture’s chart seems to resemble a bearish double top formation. The break below its neckline $26.95 points to an eventual technical measured target $24.60 which is already attained today. 20D, 50D and 100D exponential moving averages (“EMA”) have started to turn lower amid the sharp drop. Venture closed below its […]

DBS – potential trading idea going to XD (26 Mar 18)

Dear all, Based on a simple tracking of DBS’ share price performance from CD to XD, on average, DBS seems to move approximately 4-9% above its CD price, nearer to XD (translating to around S$27.86-29.13). See Table 1 below. DBS is going to XD $1.10 on 3 May. Table 1: DBS’ share price performance from CD to XD Source: Ernest’s compilations   What are the analysts saying? Based on Figure 1 below, average analyst target is around $31.15. At $27.21, this represents a potential capital upside of around 14.5%. Estimated div yield is around 4.1%. There are 17 buy; 6 […]