Ernest’s market outlook (24 Feb 17)

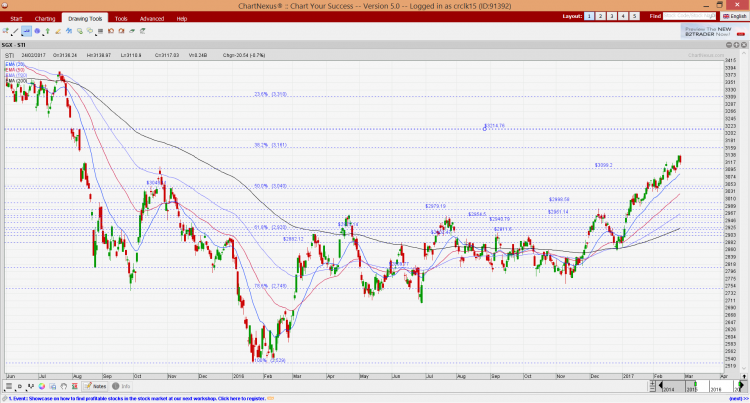
Dear all, Dow has hit daily highs for 11 consecutive sessions, its longest streak of records since 1987! What’s next for our markets?   S&P500 Just to recap what I have mentioned on 10 Feb 2017 (see HERE), I wrote “various indicators such as RSI, MACD, OBV and MFI continue to exhibit bearish divergences. ADX has slid from 41 in Dec 2016 to close at around 18 on 10 Feb 2017, which is indicative of a trendless market. RSI closed at 70 on 10 Feb 2017. Given the various chart indications, although S&P500 continues to be on an uptrend amid […]

Midas issued positive profit alert! (24 Feb 17)

Dear all, Midas issued a positive profit alert yesterday. It cited “…based on the Board’s preliminary review of the unaudited management accounts of the Group for the year ended 31 December 2016, the Group expects to record a substantial increase by over 70% in its profit attributable to owners of the Company for the year ended 31 December 2016 as compared to the same period of previous year. Such increase was mainly attributable to the contribution from our Aluminium Stretched Plates Division which we completed the acquisition on 27 July 2016.” What does this mean?   My personal take on […]

Golden Energy – Is this a laggard coal play? (17 Feb 17)

Pursuant to Golden Energy’s (“GEAR”) compliance placement at $0.670, GEAR has not closed above $0.670 since its debut on 12 Dec 2016. In fact, GEAR has slumped 21% from $0.655 on 12 Dec 2016 to $0.520 on 17 Feb 2017. This underperformance is even more glaring as compared to +24% appreciation in Geo Energy’s share price over the same period. Is GEAR a laggard coal play? Let’s take a look at some of the possible investment merits and risks.   Investment merits Targeted surge in targeted production volume GEAR has four mining concessions with the largest mining concession in BIB […]

Ernest’s market outlook (10 Feb 17)

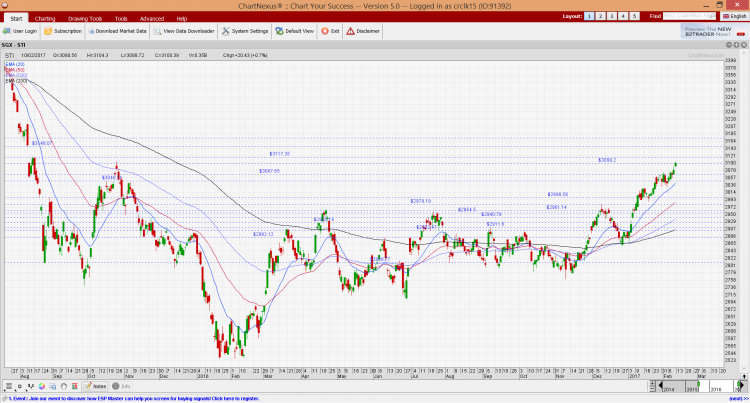
Dear all, Happy Chinese New Year 元宵节! The animal spirits seem to have descended on our Singapore market! Our STI is one of the best performing indices with a blistering 7.6% year to date return. Our FSTS ST Small Cap Index has returned 4.6% for the same period. Have you benefitted from this rally? What’s next for our markets?   S&P500 Just to recap what I have mentioned on 27 Jan 2017 (see HERE), I wrote “it is very worrying (more worrying than 13 Jan) that the various indicators such as RSI, MACD, OBV and MFI continue to exhibit bearish […]

Chart highlights on Midas, Sapphire, Sunpower, Terratech (9 Feb 17)

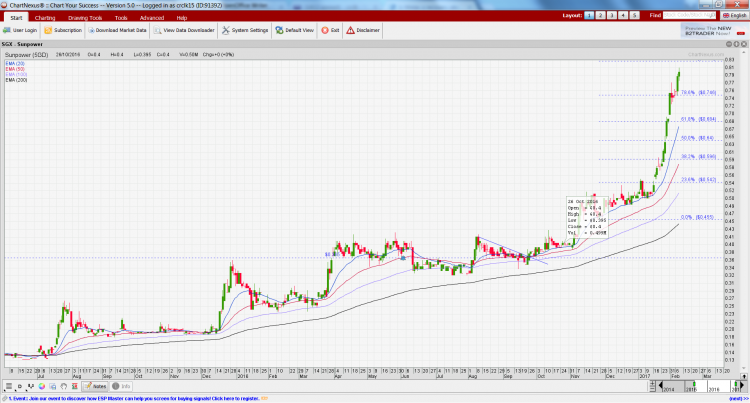
Dear readers, The animal spirits seem to have finally descended on our Singapore market! Our STI is one of the best performing indices with a blistering 6.4% year to date return. Our FSTS ST Small Cap Index has returned 3.8% year to date. I have highlighted four charts which (I feel) deserve attention. Do note the caveats below.   Midas With reference to my write-up on Midas dated 3 Feb 17 (click HERE), Midas’ inverse head and shoulders pattern seems to be confirmed with the decisive upside break above its 200D exponential moving average (“EMA”) and neckline of around $0.230 […]

Is Midas a recovery play in 2017? (3 Feb 17)

Midas has recently announced contracts after contracts. Based on Table 1 below, it is especially evident that Midas is gaining traction (particularly from 23 Jun 2016 onwards) in winning orders from clients, especially from its 32.5% stake in CRRC Nanjing Puzhen Rail Transport Co., Ltd. (“NPRT”). However, investors do not seem to share this optimism as Midas has fallen approximately 12% from $0.260 on 23 Jun 2016 to $0.230 on 3 Feb 2017. Table 1: Ernest’s compilation of contracts announced since 2015 Source: SGX; Ernest’s compilation Is the market overly pessimistic on Midas? I am fortunate to meet Mr. Patrick […]

Ernest’s market outlook (27 Jan 17)

Dear all, Happy Chinese New Year! How is your Rooster Year so far? S&P500 and STI reached near, or at my near-term resistances. What’s next?   S&P500 Just to recap what I have mentioned on 13 Jan 2017 (see HERE), I wrote “It is clear that S&P500 continues to on an uptrend amid rising EMAs. S&P500 closed at 2,275 on 13 Jan 2017. Since 8 Dec 2016, S&P500 has been consolidating between 2,238 – 2,278 and it seems to be staging an upside breakout. A sustained break above 2,278 / below 2,238 points to an eventual measured technical target 2,318 […]

Dairy Farm – hits 18 month high, all-time overbought since 1990! (27 Jan 17)

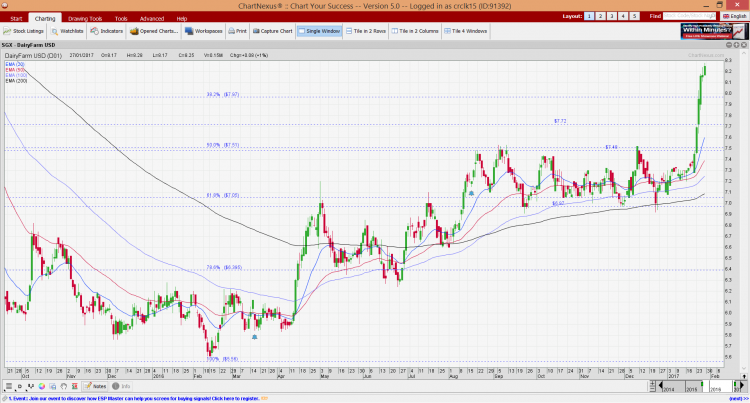
Dairy Farm hits another 18-month high on 27 Jan 2017. It has risen consecutively for the past six trading days and has surged 13.3% from an intraday low of $7.28 on 20 Jan 2017 to $8.25 on 27 Jan 2017. This has significantly outperformed the STI, as STI was only higher by 2.0% over the same period. How high can Dairy Farm go? Read on below for its chart analysis…   Chart analysis Based on Chart 1 below, Dairy Farm is on a strong uptrend, as depicted by its upwards sloping exponential moving averages (EMAs). All the EMAs are rising. […]

Ernest’s market outlook (13 Jan 17)

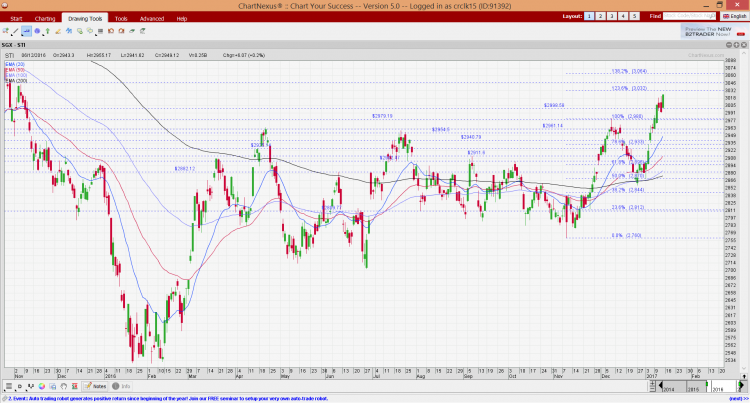
Dear all, STI performs to my expectations as it heads towards 3,040 (my eventual technical measured target price which I mentioned previously). What’s next? For the charts analysis below, you can cross – reference to my market outlook sent on 6 Jan 17 HERE. (Actually, my bi weekly market update should be done next week. However, I noticed that the market seems to be reaching some near-term potential resistances. Hence, I decided to do a market update. Due to time constraints, I did not put in Hang Seng analysis for this issue)   S&P500 Based on Chart 1 below, it […]

ISOTeam on the verge of a potential bullish chart breakout (9 Jan 2017)

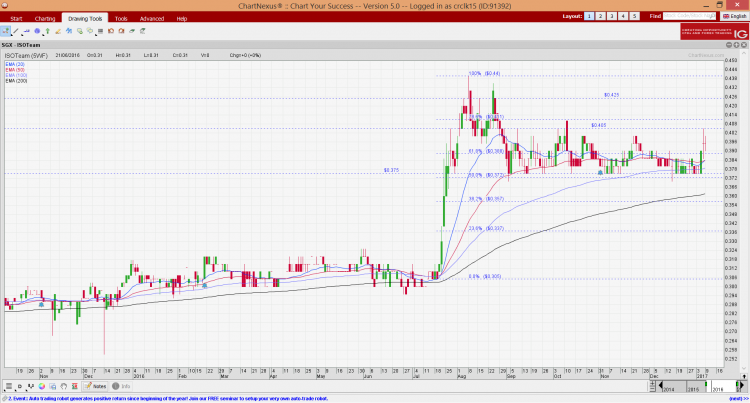
ISOTeam recently caught my attention with a surge in price, accompanied with volume. Based on Chart 1 below, ISOTeam has been trading in a tight range of $0.375 – 0.405 since 30 Aug 2016. ISOTeam closed unchanged at $0.395 on 9 Jan 2017. All the exponential moving averages (“EMAs”) are turning higher with 20D EMA on the verge of forming a golden cross with 50D EMA. Amid positive placed DIs, ADX has turned higher from 17 on 27 Dec 2016 to 30 on 9 Jan 2017, indicative of a trend. OBV has strengthened, together with other indicators such as RSI […]