STI at 3,051 – Presents some attractive opportunities (3 Oct 2021)

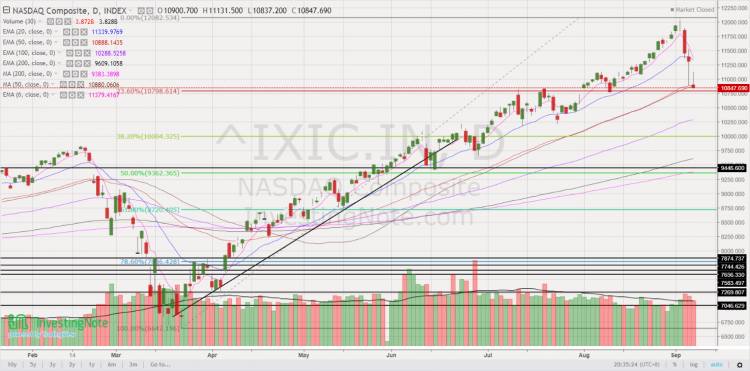
Dear all With reference to my market outlook published on National Day (see HERE), both STI and Hang Seng have hit their highs on 10 Aug and 11 Aug respectively before dipping. Based on Table 1 below, S&P500, Hang Seng and STI have fallen 1.8%, 6.1% and 4.0% respectively since my writeup. Table 1: Indices’ performance since my last writeup Source: Ernest’s compilations Amid the recent weakness, you may be wondering whether it is a good time to accumulate on weakness. Before we get to this, let’s take a look at the indices’ charts.   S&P500 closed 4,357 Based on […]

Recent weakness provides accumulation opportunities (9 Sep 20)

Dear all Based on Table 1 below, U.S. indices have fallen between 5.5% – 10% from the close of 2 Sep to 8 Sep. Nasdaq led the decline with a 10% drop. These are interesting times indeed! Why do I say so? Read on below. Table 1: Performance of various indices from 2 Sep to *8 Sep 20 Source: Ernest’s compilations (*STI and Hang Seng are based on 9 Sep closing prices) In my personal opinion, this recent U.S. market weakness provides accumulation opportunities for the well prepared and for those who have been waiting on the side-lines to accumulate […]

Sunpower and Unusual – stocks with interesting charts (26 Nov 2019)

On 6 Nov 2019, I posted an article (using data as of 5 Nov) on my blog with regard to two stocks, namely ISOTeam and Sunpower (click HERE) for their potential bullish chart developments amid volume expansion. ISOTeam touched an intraday high of $0.250 last Friday and Sunpower traded to an intraday high of $0.600 on 18 Nov 2019 as compared to $0.240 for ISOTeam and $0.525 for Sunpower at the time of my write-up. Since then, Sunpower has seen some significant profit taking and touched an intraday low $0.510 on 21 Nov. For Sunpower, I have taken profit when […]

Two stocks, ISOTeam and Sunpower with potential bullish stock charts (5 Nov 2019)

This week, two stocks, namely ISOTeam and Sunpower caught my attention with their potential bullish chart developments amid volume expansion.   1. ISOTeam Chart looks positive with strengthening indicators and volume Based on Chart 1 below, ISOTeam has been trading in a range $0.225 – 0.245 since 2 Aug 2019. ADX is starting to rise (closes at 18.7) amid positively placed DIs. In addition, indicators such as MACD, OBV and RSI are strengthening. MACD has done a bullish MACD line crossover and centerline crossover. A sustained breach above $0.245 with volume expansion is positive for the chart with an eventual […]

Hang Seng & STI have fallen close to 2,900 & 250 points in one month! (28 May 19)

Dear readers, Asian markets have fallen quite a bit in the past one month. For example, Hang Seng has fallen close to 2,900 points since touching a high of 30,280 on 15 Apr to trade 27,391 which is the low last seen in January. STI has fallen almost 250 points from an intraday high of 3,415 on 29 Apr to close 3,165 today. Looking at the indices may be deceiving as many shares have fallen a lot. For example, based on Table 1 below, most stocks have fallen at least 10%, with Sembmarine tumbling almost 17% in less than a […]

Ernest’s market outlook (10 Feb 17)

Dear all, Happy Chinese New Year 元宵节! The animal spirits seem to have descended on our Singapore market! Our STI is one of the best performing indices with a blistering 7.6% year to date return. Our FSTS ST Small Cap Index has returned 4.6% for the same period. Have you benefitted from this rally? What’s next for our markets?   S&P500 Just to recap what I have mentioned on 27 Jan 2017 (see HERE), I wrote “it is very worrying (more worrying than 13 Jan) that the various indicators such as RSI, MACD, OBV and MFI continue to exhibit bearish […]

Chart highlights on Midas, Sapphire, Sunpower, Terratech (9 Feb 17)

Dear readers, The animal spirits seem to have finally descended on our Singapore market! Our STI is one of the best performing indices with a blistering 6.4% year to date return. Our FSTS ST Small Cap Index has returned 3.8% year to date. I have highlighted four charts which (I feel) deserve attention. Do note the caveats below.   Midas With reference to my write-up on Midas dated 3 Feb 17 (click HERE), Midas’ inverse head and shoulders pattern seems to be confirmed with the decisive upside break above its 200D exponential moving average (“EMA”) and neckline of around $0.230 […]