Unusual – Challenging its key resistance $0.270 – 0.280 with volume expansion (4 Nov 2019)

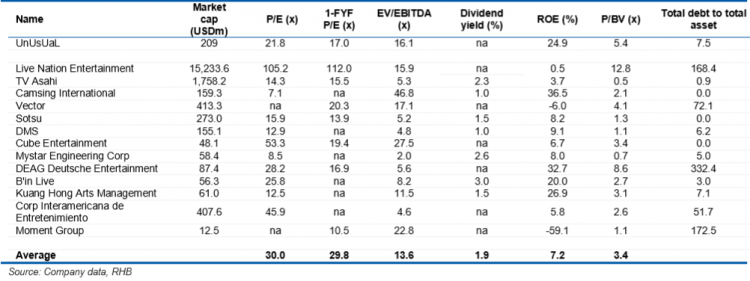
Last Friday, Unusual Limited (“Unusual”) caught my attention. It is testing its key resistance $0.270 – 0.280, accompanied by an increase in volume for the past three days with above average volume in two out of the past three days. It closed at $0.275 on 4 Nov 2019. Day range 0.270 – 0.280. Furthermore, as its 2QFY20F results are just around the corner, it may be an opportune time to take a look at this stock.   Interesting points A) Chart looks positive with strengthening indicators and volume Based on Chart 1 below, Unusual has been challenging its key resistance […]
Hi-P – bearish engulfing candle forms after rising for 12 out of 15 days (29 Oct 2019)

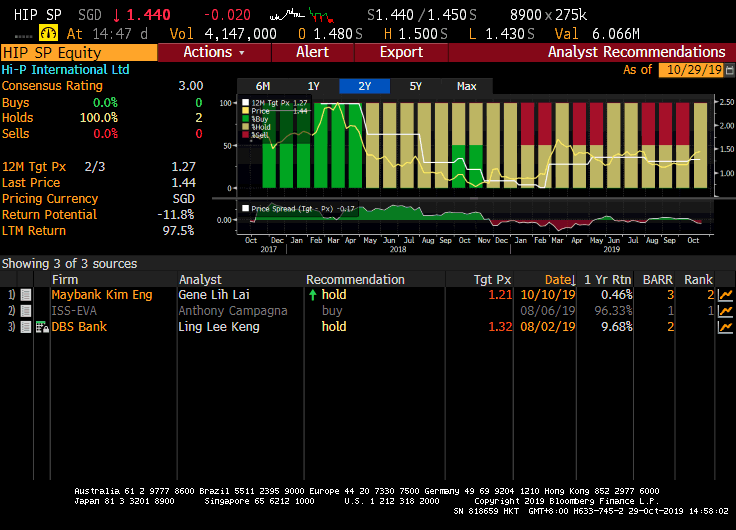
This week, Hi-P has caught my attention with its 33% surge from the intra-day low of $1.13 on 7 Oct 2019 to trade to an intra-day high of $1.50 on 29 Oct 2019. In addition, it has risen 12 out the past 15 trading days with RSI touching a recent high of 81.8 on 25 Oct 2019. Based on Hi-P’s chart, it seems to present a favourable risk to reward short trade. Please see the basis and more importantly, the risks.   Basis a) Hi-P trades above the higher analyst target price $1.32 Average analyst target price for Hi-P is […]

Eagle Hospitality Trust falls to all time low price amid all time low RSI (28 Oct 19)

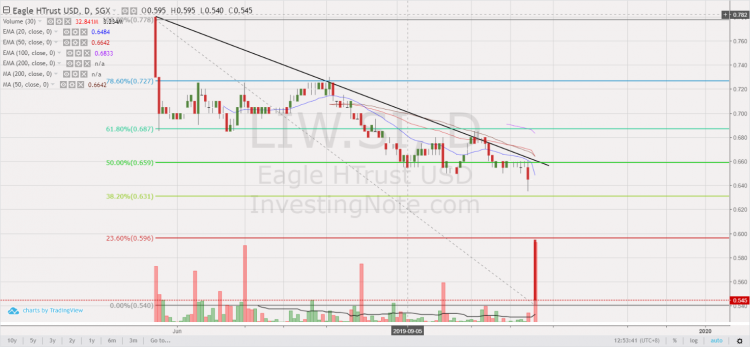
Dear all, S&P500 hit a near intra-day record high at 3,027 on 25 Oct 2019 (one-point shy of its intra-day record high 3,028 on 26 Jul 2019). However, such optimism and risk on sentiment cannot be felt on this SGX listed stock Eagle Hospitality Trust (“EHT”). It fell 16% last Friday to close $0.545. This is an all-time low price since its IPO (IPO offer price US$0.780) on 24 May 2019. Let’s take a look why this EHT has under-performed and why it has caught my attention this week.   Reasons why EHT has underperformed till date The below list […]

Chasen – a bullish double bottom making in the making? (23 Oct 19)

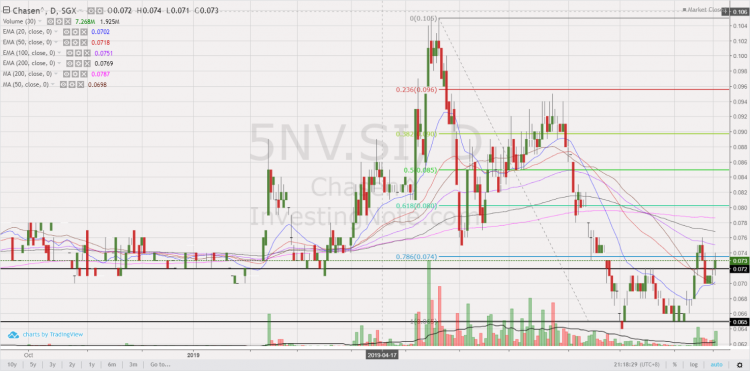
Dear all, This week, Chasen catches my attention as it seems to be forming a bullish double bottom on its chart. I have appended my personal chart analysis, together with some potential positive and negative points on the company. Read on for more below.   Chasen’s chart analysis Based on my personal interpretation of Chasen’s chart, it seems to have tested its double bottom neckline around $0.070-0.072 for the past few days. For the past two days, it managed to close higher consecutively with above average volume. In fact, Chasen closed today with 7.3m shares changing hands, 3.8x above its […]

Nasdaq – potential bearish head and shoulders formation in the making? (29 Sep 19)

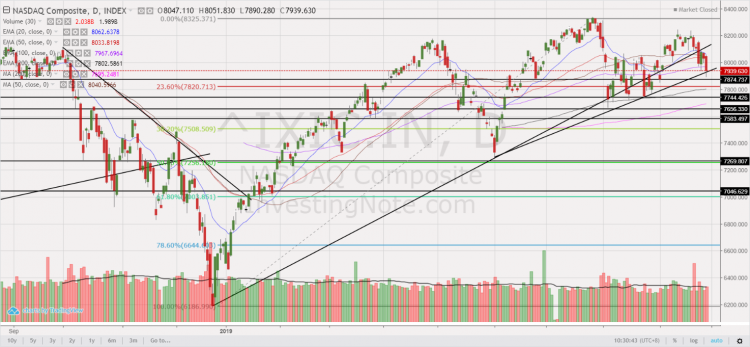
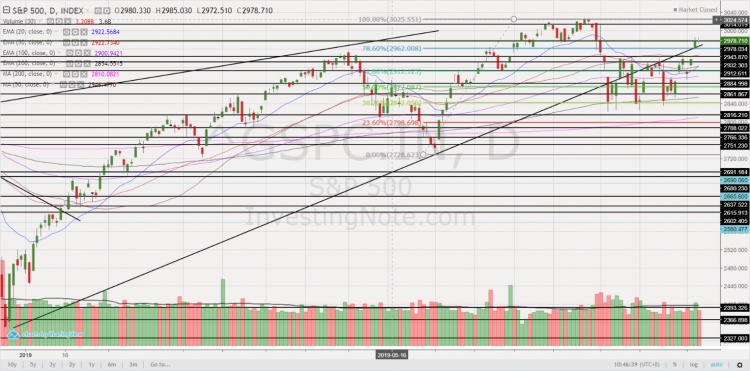
With reference to my earlier write-up (click HERE) titled “S&P500 at 2,979 – limited potential upside (8 Sep 19)”, S&P500 touched intraday highs of 3,021 – 3,022 on 12 Sep 2019 and 19 Sep 2019 but it was still lower than the record intraday high of 3,028 on 26 July 2019. S&P500 closed at 2,962 on 27 Sep 2019. Hang Seng and STI touch one-month intraday highs on 13 Sep 2019 before profit taking sets in. October is likely a volatile month ahead given (just to cite a few examples) more news on trade talks (e.g. U.S vs China; U.S. […]

S&P500 at 2,979 – limited potential upside (8 Sep 19)

With reference to my earlier write-up (click HERE) titled “Why am I cautious going into July…”, July was coincidentally the peak for S&P500. Hang Seng touched an intraday high of 29,008 on 4 Jul 2019 before slumping 4,108 points to an intraday low of 24,900 on 15 Aug 2019 (Hang Seng closed at 26,691 on 6 Sep 2019.) Personally, given the current market levels and information, I am not comfortable to raise my current percentage invested from 53% to significant levels (say >80%). Why am I cautious in the market? Do read on…   Factors supporting my cautious basis Above […]

ISOTeam – on the verge of a bullish break from a potential double bottom formation! (21 May 2019)

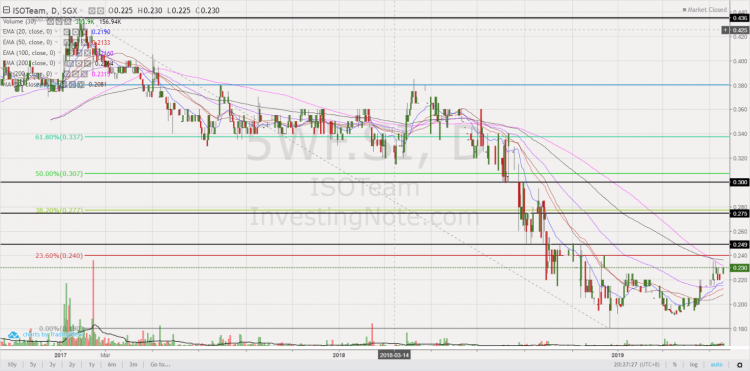
Previously, I have done a write-up (click HERE) on ISOTeam (“ISO”) after interviewing Anthony, CEO and Richard, GM on an exclusive basis in Dec 2018. I have bought in at that time and have taken profit in Jan 2019. Since Apr, I have been accumulating ISO, as its chart seems to portend a potential upside breakout after a lengthy potential double bottom formation. ISO closed at $0.230 on 21 May 2019. Let’s take a look at its investment merits and more importantly, its investment risks below.   Investment merits a) Potential bullish break from a double bottom formation Since 2017, […]

Sinopec falls 33% since last year; nears 19-year oversold level (14 May 19)

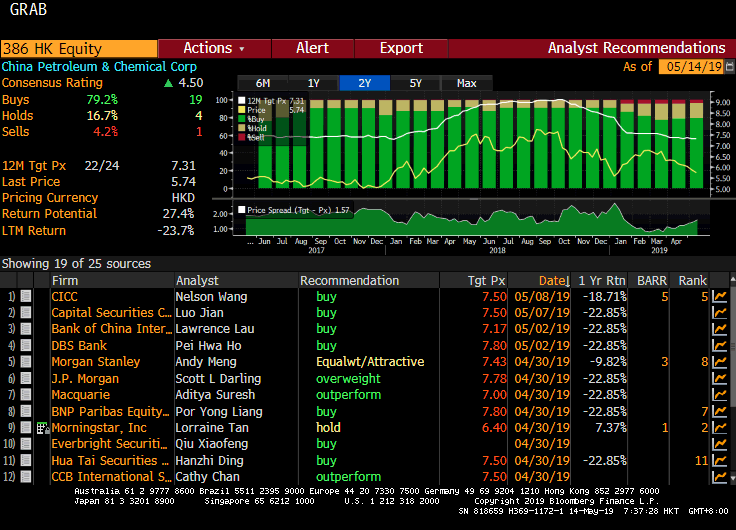
Dear all This week, Sinopec (00386.HK) caught my attention with its 33% fall since 21 May 2018. With its sharp fall, it has become extremely oversold with RSI at 15.1. Given the basis below, my personal view is that Sinopec may be presenting a favourable risk reward setup for a long trade. Do take a look at the basis and more importantly, the risks inherent in such trades.   My personal basis a) Attractive valuations At HKD5.63, Sinopec is trading at approximately 10.3x current PE and 0.8x P/BV. These valuations are attractive as compared to its 10-year average PE and […]

S&P500 logged its largest one day fall since Jan. Buy more, or head to the exit? (27 Mar 2019)

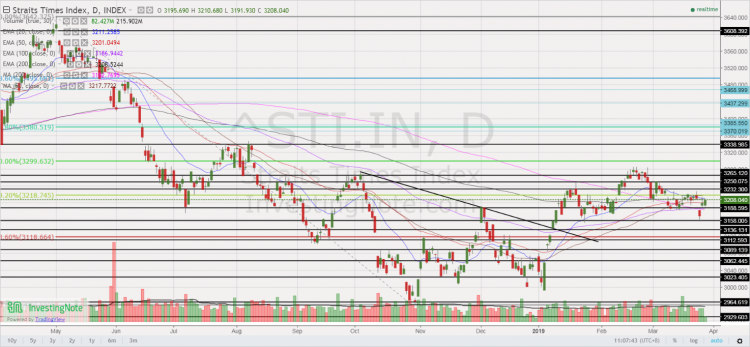
Dear readers, Last Fri, S&P500 logged its largest one day fall since 3 Jan 2019, due in part to the weak European PMI and the yield curve inversion between U.S. 3-month bill and 10-year note yields. At the time of writing this, Dow closed 0.55% higher on Tues as U.S. 10 year bond yields stabilise. Is last Fri’s fall the precursor to something more serious? Or it is a false alarm?   First things first, what are the reasons for the sharp rally since late Dec? S&P500 has rallied approximately 20.1%, or 471 points from the intra-day low of 2,347 […]

Hong Fok hits 10-year overbought level and up 12 out of 13 trading days! (19 Mar 19)

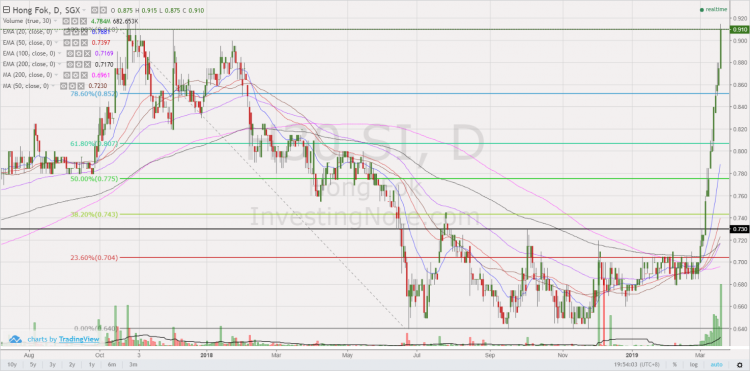
This week, Hong Fok catches my attention this week because a) It has risen approximately 33% in 12 out of the past 13 trading days from an intraday low of $0.685 on 28 Feb 2019 to close $0.910 today. It is noteworthy the 13th day is at an unchanged level. In other words, Hong Fok has not had a down day since 28 Feb 2019; b) At $0.910, this is near its 25 Oct 2015 high of around $0.91-0.920. The previous high which is higher than $0.920 occurred in Sep 2014. I.e. Hong Fok is trading near a four plus […]