Wilmar – Is this a good time to accumulate? (2 Sep 2020)

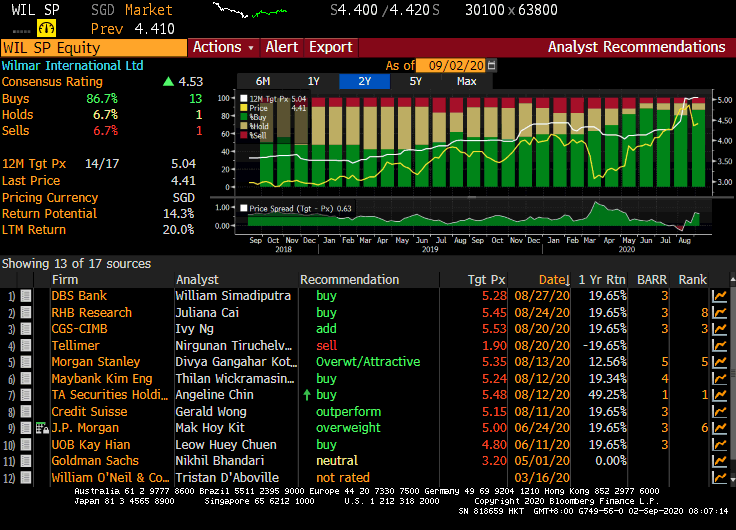
Wilmar recently caught my attention. It has fallen approximately 11% from an intraday high of $4.95 on 7 Aug 2020 to close $4.41 on 1 Sep 2020. Six points attracted me to Wilmar. Let’s take a look. 1. Imminent catalyst i.e YKA IPO – left one approval to go Wilmar cited that its Chinese subsidiary, Yihai Kerry Arawana Holdings Co., Ltd (“YKA”), has obtained listing clearance from the Shenzhen Stock Exchange (“SZSE”) ChiNext Board Listing Committee (the “Committee”) and has submitted the updated prospectus to the China Securities Regulatory Commission (“CSRC”) for final registration approval for listing on SZSE ChiNext Board […]
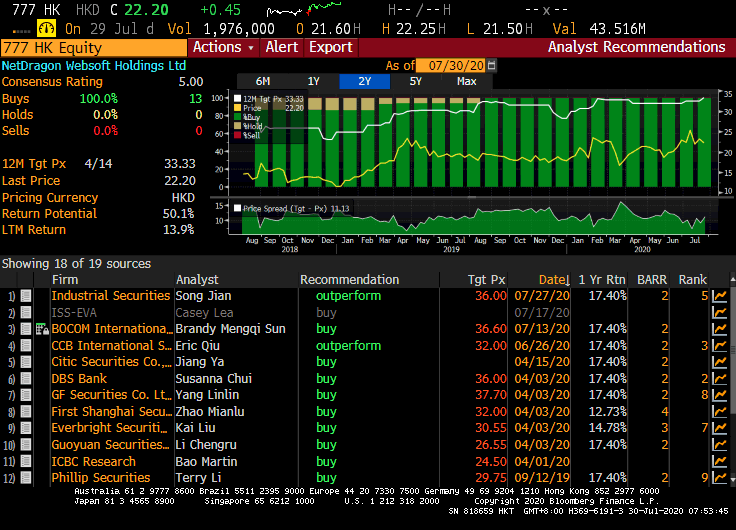
China Everbright Water and NetDragon look interesting… (30 Jul 2020)

This week, notwithstanding the continuous interest in glove companies, pharmaceutical companies etc, there are some companies which seem to have some steady inflows, based on chart observations. Two companies come to my mind, namely NetDragon and China Everbright Water Limited (“CEWL”). What is so interesting about the above companies? Let’s take a closer look at its chart and other noteworthy points. 1. NetDragon – on an uptrend, with all 13 analysts calling it a BUY Company description – before I delve into the chart… Some readers may not be familiar with NetDragon (HKSE: 0777). According to NetDragon company description, it […]

China Everbright Water – bullish break above trading range (10 Jun 2020)

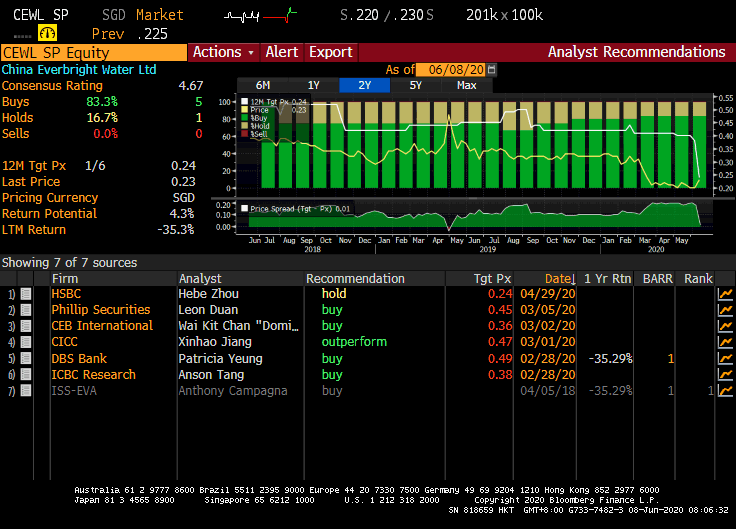
This week, China Everbright Water Limited (“CEWL”) catches my attention this week. Since 17 Mar 2020, CEWL has been trading sideways from $0.200 – 0.230. Based on chart, CEWL seems to be on the verge of a breakout. It last trades at $0.235. What is so interesting about CEWL? Let’s take a closer look at its chart and other noteworthy points.   CEWL – Broke out of 2+ month trading range with volume expansion Bullish chart underpinned by rising EMAs and volume Based on Chart 1 below, since 17 Mar 2020, CEWL has been trading sideways from $0.200 – 0.230. […]

S&P500 has rebounded 31% from 23 Mar 20! Time to buy, hold or sell (19 Apr 20)?

S&P500 has staged a whopping 683 points, or 31% rebound from its intraday low of 2,192 to close 2,875 on 17 Apr 20. Many clients have asked me (almost daily) whether we have already seen the bottom and is this a good time to buy stocks etc. At 2,875, S&P500 is just 15% away from its record intraday high of 3,394 on 19 Feb 2020. The rally in Wall Street is at a stark contrast to grim news from Main Street in terms of job losses; significant number of deaths from Covid 19; lockdowns and poor corporate results. Both bull […]

Singpost – grossly oversold; closes at prices last seen in May 2009! (2 Mar 2020)

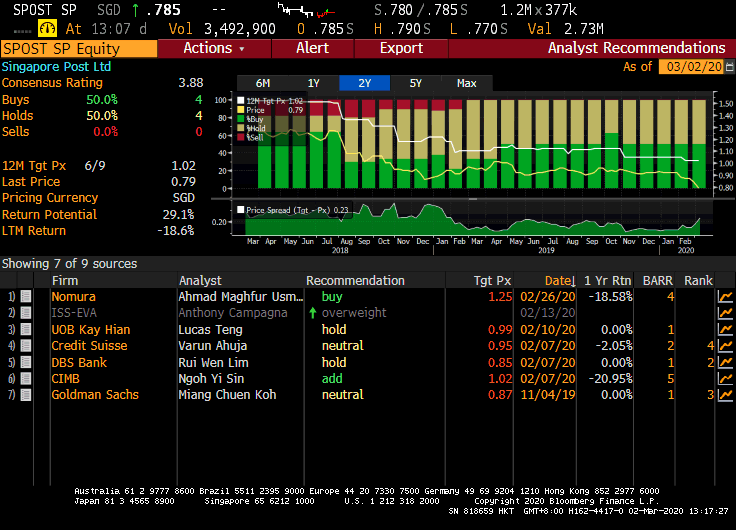
Dear all, It has been an extremely busy and hectic period with the U.S. indices clocking in their largest record weekly percentage drop last week. This week, Singpost caught my attention. Singpost has fallen 17.4% from its intraday high of $0.950 on 3 Jan 2020 to close at $0.785 today which is the lowest close since 5 May 2009. RSI closes at a grossly oversold level 10.7, almost at an all-time low last seen in June 2003. Why does it attract my attention? Read on for more.   Chart – Seems to indicate selling pressures may ease in the near […]

China Aviation – chart looks bullish amid analyst buy calls; below average valuations, supported with 3.6% dividend yield (3 Jan 2020)

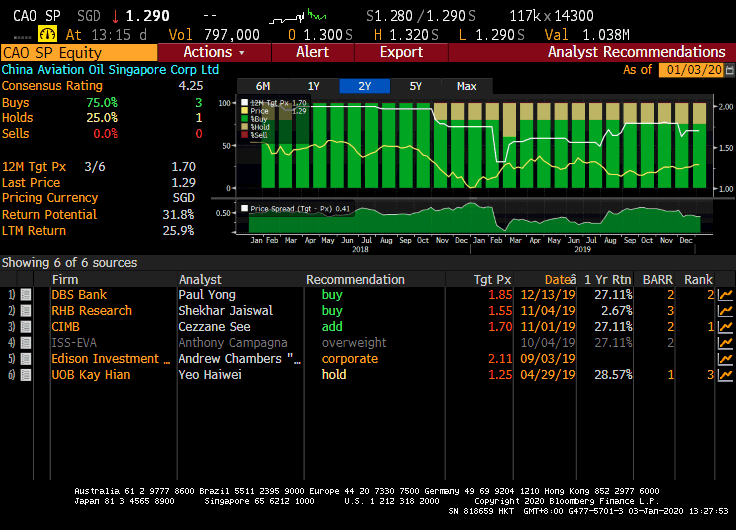
Dear readers, Happy New Year! Hope your new year has been great. Market has been extremely interesting for the past couple of months. Recently, China Aviation (“CAO”) caught my attention with its bullish chart and looks interesting on a risk to reward aspect. CAO closed at $1.30 last Fri. Day range was $1.29-1.32. Read on for more.   Why did CAO catch my attention? a) Average analyst target price $1.70 With reference to Figure 1 below, average analyst target is around $1.70. Together with an estimated dividend yield of around 3.6%, CAO offers a total potential return of around 34%. […]

STI – to head towards 3,390 points in 1Q2020? (25 Dec 19)

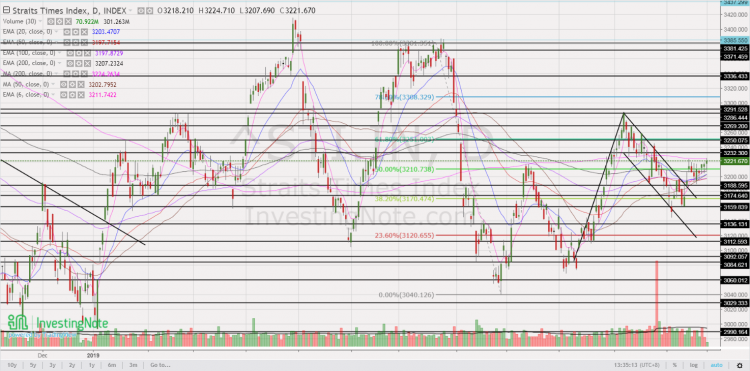
Merry Xmas! As we approach end 2019, most market strategists are putting their market estimates for end 2020. Although I do not profess to be in the league of these market strategists, just for fun, I am expecting STI to head towards 3,390 in 1Q2020. STI closed at 3,222 on 24 Dec 2019. I have outlined my basis and the risks involved.   Factors for my bullish basis a) Chart looks positive after bullish break Based on Chart 1 below, STI has staged a bullish break above its flag formation on 12 Dec 2019. Notwithstanding below average volume for the […]

Frencken nears 14Y overbought RSI level amid 10Y high prices (19 Nov 2019)

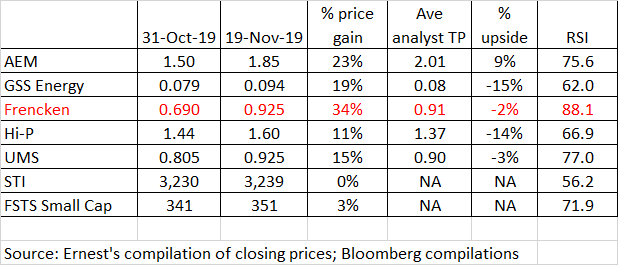
This week, Frencken has caught my attention with its 34% surge from $0.690 on 31 Oct 2019. It closed $0.925 on 19 Nov 2019. At $0.925, this is very near to its 10-year high closing price $0.930 set on 18 Nov 2019. Since 31 Oct 2019, it has risen 10 out of the past 13 trading days with two days having closed unchanged. RSI closed at 88.1 on 19 Nov 2019, which is near a 14 year overbought level. Based on Frencken’s chart, it seems to present a favourable risk to reward short trade. Please see the basis and more […]

Yangzijiang – may be ripe for a bounce (12 Nov 2019)

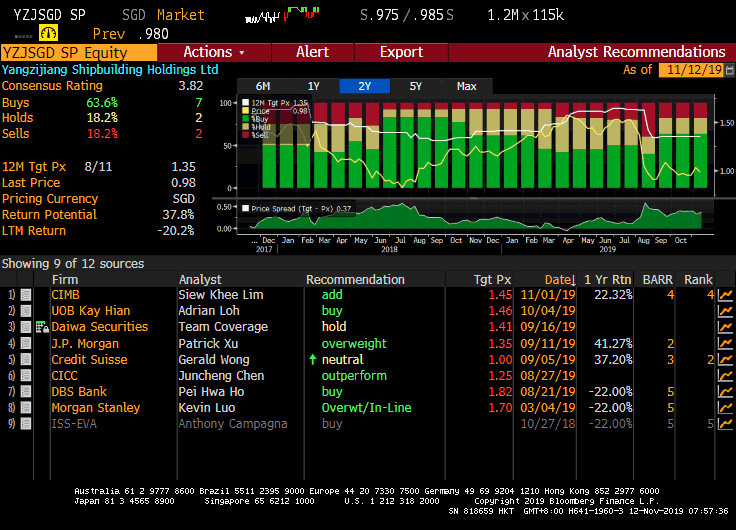
This week, besides Food Empire which caught my attention (click HERE), Yangzijiang (“YZJ”) also caught my attention for being a laggard. It has given up all the gains since its large 7% jump on 5 Nov 2019. Notwithstanding the recent mild profit taking, it seems to be holding up well above its uptrend line. Given that its results are just around the corner, it may be an opportune time to take a look at YZJ. Do take a look at the basis, and more importantly, the risks.   Basis A) Chart analysis – a breakout / breakdown seems to be […]

Food Empire – potential bullish chart development amid volume expansion (11 Nov 2019)

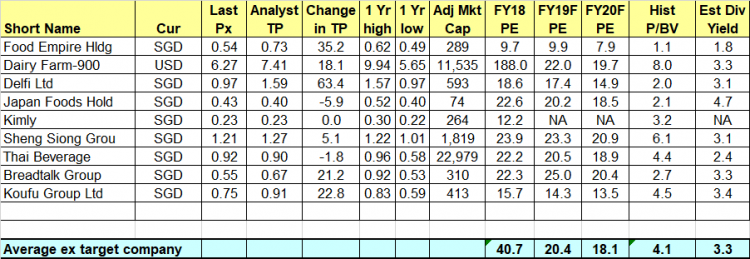
This week, Food Empire caught my attention with their potential bullish chart developments amid volume expansion. This may be an opportune time to take a look at Food Empire on the back of its potential bullish chart and strong results released this evening. Do take a look at the basis and more importantly, the risks.   Basis A) Chart looks positive with strengthening indicators and volume Based on Chart 1 below, Food Empire has been trading in six-month trading range $0.490 – 0.550 and is now on the verge of challenging its key resistance around $0.550 with increasing volume. It […]