Hi-P – Chart looks interesting with rising ADX, amid positively placed DI (21 Feb 19)

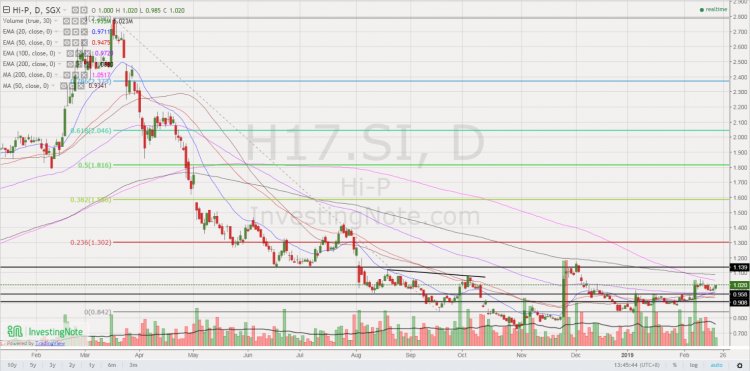
This week, Hi-P caught my attention due to its chart. It last trades at $0.990. Day range 0.985 – 1.00. Let’s take a look. Basis below 1.Chart looks interesting with rising ADX, amid positively placed DI Hi-P has been trading in a tight range $0.885 – 0.960 since 8 Jan 2019 and broke out with strong volume on 11 Feb 2019. ADX has been rising to trade 31.6 amid positively placed DI, indicative of a trend. RSI last trades 57.9. Today is T+8 of 11 Feb upmove. There has been some price weakness on 15 & 18 Feb as I […]

Sing Medical – Chart seems to be strengthening (13 Feb 2019)

This week, Sing Medical’s (“SMG”) caught my attention. At the time of writing this write-up, SMG is trading +0.005 to $0.430. Day range 0.425 – 0.430.   Some interesting observations on SMG a) Chart seems to be strengthening Based on Chart 1 below, SMG seems to have breached the near term downtrend line established since Mar 2018. Today is T+7 of the sharp upmove dated 31 Jan 2019 thus, I guess those contra players (who plan to contra and not hold the stock) have already exited. Indicators such as OBV, RSI and MACD are strengthening. ADX last trades 34.5 on […]

S&P500 has jumped 10.6% since 26 Dec! Should we chase the rally? (12 Jan 2019)

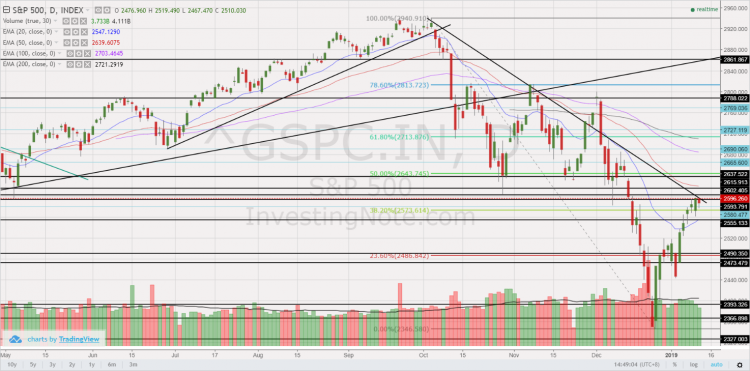
Dear all Since my write-up on 23 Dec 2018 (see HERE), S&P500 has jumped approximately 7.5% since then. In fact, S&P500, after touching an intraday low of 2,347 on 26 Dec 2018, it has risen 249 points or 10.6% to close 2,596 on 11 Jan 2019. Is this the start of another upcycle in equities? Should we chase the rally? Below are some of the positive and negative points which readers can take into consideration before we can arrive to a well thought out answer.   Potential positive points supporting the continuous rally a) Fed may acknowledge rising risks to […]

ISOTeam trades near 4 year low despite record order books and bright outlook (10 Jan 19)

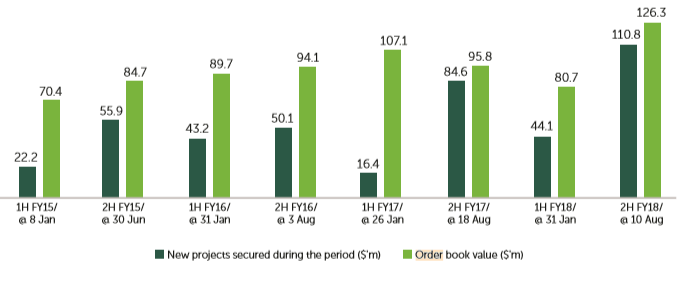
ISOTeam (“ISO”) caught my attention. Despite sitting on a record order book, ISO has tumbled approximately 44% from an intra-day high of $0.385 on 10 Apr 2018 to close near a four year low at around $0.215 on 10 Jan 2019. The share price decline was attributable in part to its 4QFY18 surprise loss announced in Aug 2018 (financial year ends in Jun). Nevertheless, my gut feel is that 4QFY18 should mark the trough in earnings and results should improve on a quarter on quarter basis in the next few quarters. As this company is a potential turnaround play, I […]

SIA Engineering trades at 9-year low price and 10-year low valuations (26 Dec 18)

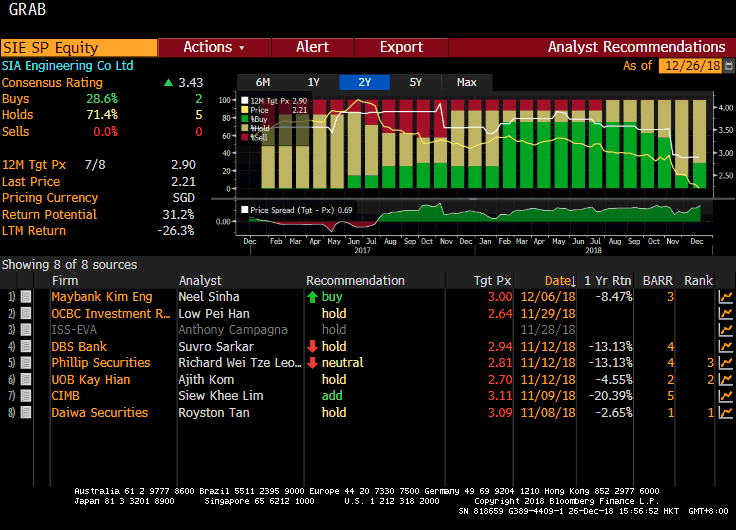
SIA Engineering (“SIE”) catches my attention this week because 1) Share price has fallen to the lows last seen in May 2009 – 9 +year low with negative news, more or less well known. It last trades at $2.20 on 26 Dec 2018. Based on Maybank’s report out this month, SIE management has flagged out challenges in their industry approximately two years ago –> on lower maintenance frequency required by newer aircraft and fleet growth at low cost carriers (“LCC”) requiring SIE to think of new solutions to reduce aircraft downtime at hangars; 2) At $2.20, RSI last trades at […]

S&P500 has slumped 13.7% in Dec, largest percentage fall since 1931! Has the bull market ended? (23 Dec 18)

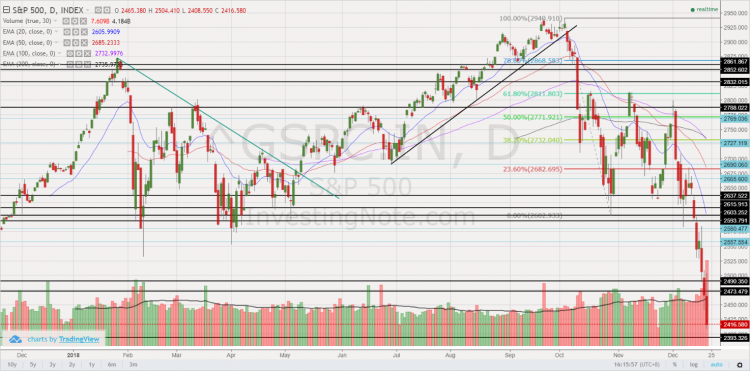
Dear all After hitting an intra-day high of 2,941 on 21 Sep 2018, S&P500 has tumbled 17.9% or 525 points to close 2,416 on 21 Dec 2018. In fact, S&P500 has just logged the worst monthly performance in Dec since 1931! Dow has also fallen 3,535 points from the intraday high of 25,980 on 3 Dec 2018 and 4,507 points from the intraday high of 26,952 on 3 Oct 2018. What is happening? Is Armageddon coming?   Most things have not changed since 21 Sep, except for… In Sep, when S&P500 hit 2,940, the usual concerns were also there, namely […]

STI has dropped almost 17% since 2 May! Is a bear market coming? (14 Oct 18)

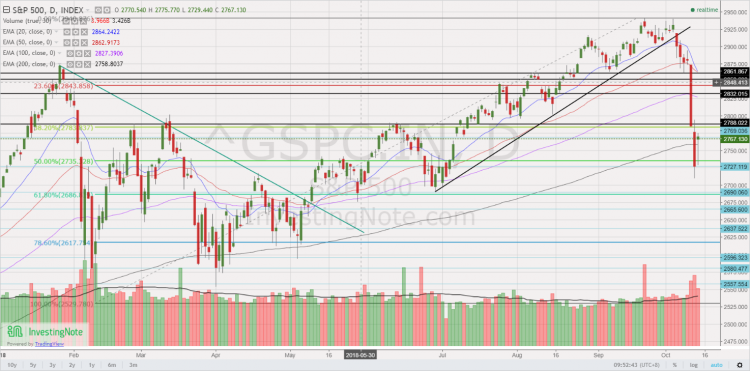
Dear all, U.S. equity markets have logged their worst weekly performance in the past six months. For our local market, STI has dropped 16.7% from an intra-day high of 3,642 on 2 May 2018 to an intra-day low of 3,035 on 11 Oct 2018. It closed at 3,069 on 12 Oct 2018. Is a bear market coming? There are mixed views. Bears are saying that we have not reached the bottom yet. Some perma-bears are even saying this may be the start of the bear market. Bulls are saying that this represents a window of opportunity to accumulate stocks on […]

Yangzijiang – 2nd worst performing STI stock with -40% YTD (6 Aug 2018)

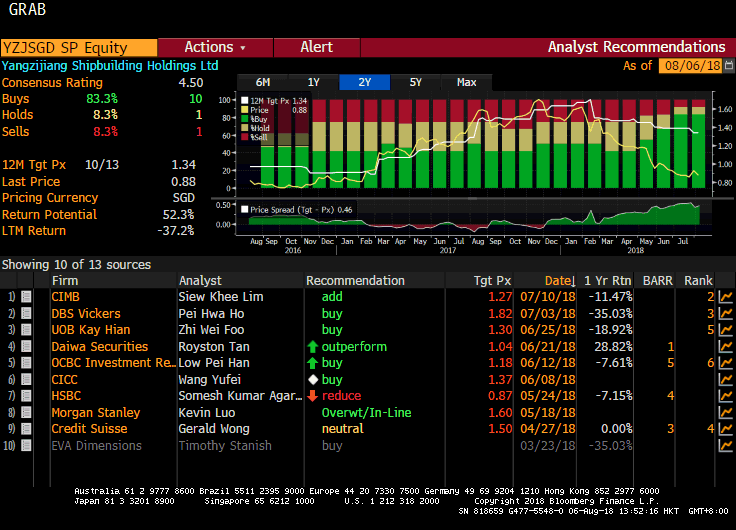
Yangzijiang (“YZJ”) has been the 2nd worst performing STI stock with -40% year to date (“YTD”) return based on the closing price of $0.880 on 6 Aug 2018 (click HERE). In the past four days, YZJ has weakened approximately 9.3% after hitting the intraday high of $0.970 on 31 Jul 2018. Is this recent share price decline the harbinger of poor results to be released on 7 Aug, after market?   2QFY18 results unlikely to be poor Based on my personal view, 2QFY18F results are unlikely to be poor based on the following points: a) Number of vessels delivered Based […]

Island reversal; potential Dow Theory sell signal… What does this mean for our markets? (30 Mar 18)

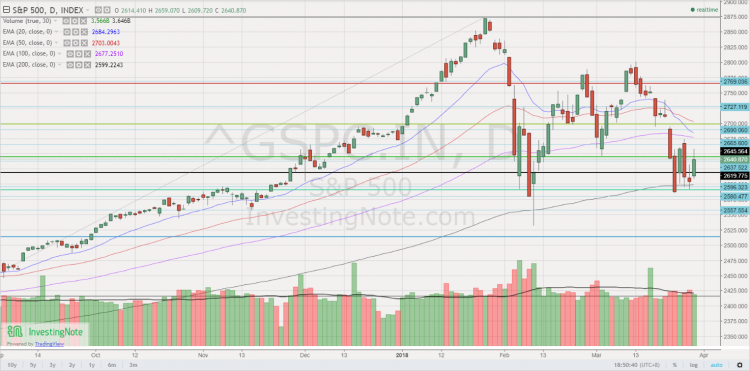
Dear all, Besides the headline grabbing news on Facebook and the U.S. China trade tariffs etc. some of you may have noticed other equally interesting / alarming headlines such as the island reversal chart formation seen in Nasdaq 100 (click HERE) and Nasdaq Composite index, and reports that a potential “Dow Theory” sell signal, one of the oldest and arguably the most widely followed market timing tool, may happen anytime (click HERE). What should we do? Let’s take a closer look at the charts and my personal action plan.   S&P500 closed 2,640. Day range 2,610 – 2,659 Based on […]