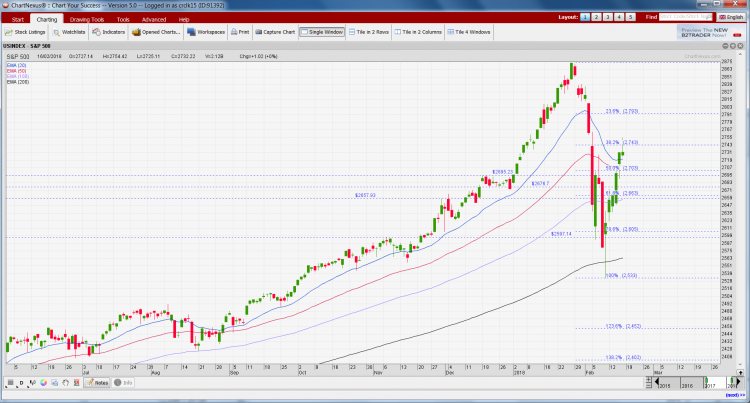
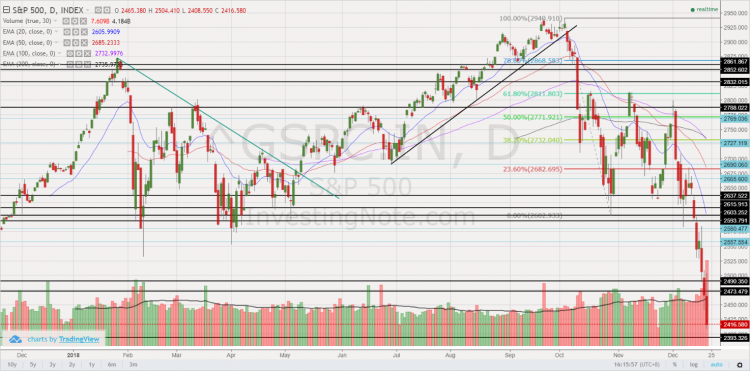
S&P500 has slumped 13.7% in Dec, largest percentage fall since 1931! Has the bull market ended? (23 Dec 18)

Dear all After hitting an intra-day high of 2,941 on 21 Sep 2018, S&P500 has tumbled 17.9% or 525 points to close 2,416 on 21 Dec 2018. In fact, S&P500 has just logged the worst monthly performance in Dec since 1931! Dow has also fallen 3,535 points from the intraday high of 25,980 on 3 Dec 2018 and 4,507 points from the intraday high of 26,952 on 3 Oct 2018. What is happening? Is Armageddon coming?   Most things have not changed since 21 Sep, except for… In Sep, when S&P500 hit 2,940, the usual concerns were also there, namely […]

S&P500, Nasdaq and Russell 2000 hit records, time to switch to underperforming markets? (24 Aug 18)

Dear all, S&P500, Nasdaq and Russell 2000 hit records last Friday with S&P500 closing at 2,875. However, our STI has dropped 11.8% after hitting a decade high of 3,642 on 2 May 2018. Hang Seng has also tumbled 17.4% after hitting a high of 33,484 on 29 Jan 2018. Is this the time to switch out of the U.S. markets and plough it back to STI and Hang Seng? This seems to be the question on most investors’ minds as I am also posed this question during a live interview on Money FM89.3 on last Thursday. Let’s take a closer […]

Singtel hits multi-year low and all time oversold since 2000! (3 Jul 2018)

Singtel closed -$0.03 to $3.02, the lowest close since Jun 2012. Based on Bloomberg, it is trading at approximately 5.9% estimated div yield. Ave analyst target is around $3.92. Hence total potential upside is around 35.7%. What has happened to Singtel which hit multi-year lows despite analysts’ buy calls? Is this a buying opportunity? Or is it a falling knife?   Singtel – takeaways from some analyst reports The recent weakness in Singtel may be attributed to its challenging industry, especially when the industry faces new entrants in both Singapore and Australia. Although Singtel may lack near term catalysts, based […]

EC World Reit – potential strong growth ahead (29 Jun 18)

Dear all, Reits are clearly not in our investors’ favour as evidenced by the 10.2% fall in FTSE Reit index (FSTAS8670.IN), which closed 786 on 29 Jun 2018, after hitting a multi-year high of 875 in Jan 2018. Most analysts or strategists will recommend reits with distribution per unit (“DPU”) growth, so as to combat the rise in interest rates. EC World Reit (“EC”) may be one with DPU growth. I have the privilege of meeting Mr Goh Toh Sim, Executive Director & CEO of EC and Mr Li Jinbo, Head of Investment of EC (“Management”) for a 1-1 discussion […]

STI notched a ten year high on 2 May – is it a screaming buy for all SG stocks (11 May 18)

Dear all, Dow has logged a seventh consecutive rise and small caps as measured by S&P600 index have just closed at a record high as of 11 May 2018. Our Singapore market has also done us proud too by becoming Asia’s best performing equity market on 2 May 2018. In view of the above, is it a screaming buy for our Singapore market, especially our small caps which have under-performed? Let’s take a closer look at the charts and my personal action plan.   S&P500 closed 2,728. Day range 2,717 – 2,733 Based on Chart 1 below, S&P500 seems to […]

S&P 500 jumped 4.3% last week, the best performance since Jan 2013! Is the recent sell off over? (18 Feb 18)

Last week, all three U.S. major indices (i.e. DOW, S&P500 and Nasdaq) have registered their best weekly performance in years. Is the recent sell off over? Let’s take a look.   7 observations on the market U.S 10Y bond yield is still relatively high at 2.875% (click HERE) vis-à-vis 2.418% a year ago. If it suddenly surges to around 3%, it may fuel another sell off; Inflation based on several indicators such as core CPI / core PPI released the week of 12 – 16 Feb are rising faster than forecasts. However, market shows limited reaction towards the inflation data […]

Ying Li’s chart – consolidating nicely around $0.14+, before the next up-move? (12 Dec 17)

Ying Li’s chart seems to be consolidating nicely around $0.14+. Where will it go from here?   Personal chart observation With reference to Chart 1 below, Ying Li surged to an intraday high of $0.164 on 28 Nov 2017 immediately after the divestment announcement (See elaboration and announcement link below), before profit taking set in. Since then, Ying Li seems to be consolidating around $0.14+. Since 16 May 2017, Ying Li has been setting higher lows and higher highs. All the exponential moving averages (“EMAs”) have either stopped declining, or are moving higher. Although Ying Li’s share price has languished […]

Billion market cap stocks with >=3% dividend yield (12 June 17)

Business Times has an interesting article published today “High-yielding billion-$ stocks go beyond STI”. However, I noticed in the article, it did not list all the stocks with market cap >=S$1 billion and dividend yields >=3%. Therefore, I have sourced data from Bloomberg and have compiled a list of Singapore listed stocks with the following criteria: a) Market capitalisation in SGD terms >= S$1 billion; b) Estimated dividend yields >= 3%. Furthermore, I have sorted the stocks with the above criteria, sorted by total potential return (i.e. Potential capital gain + estimated dividend yield). Table 1 lists the top 5 […]

Ernest’s market opinion (19 May 17)

Dear all Below is my personal opinion on the market. As previously mentioned to my clients, I aim to reduce my percentage invested in stocks (currently around 130% invested), especially the non-performing stocks, with no immediate near term catalysts. I am cautious on the market in the next 1-2 months because a) The large market run up year to date. STI has appreciated approximately 12% YTD and 22% for the past one year; b) June is likely to be a quiet month as most companies have reported results and some of the blue chips have already ex dividend. i.e. limited […]

Ernest’s market outlook (24 Feb 17)

Dear all, Dow has hit daily highs for 11 consecutive sessions, its longest streak of records since 1987! What’s next for our markets?   S&P500 Just to recap what I have mentioned on 10 Feb 2017 (see HERE), I wrote “various indicators such as RSI, MACD, OBV and MFI continue to exhibit bearish divergences. ADX has slid from 41 in Dec 2016 to close at around 18 on 10 Feb 2017, which is indicative of a trendless market. RSI closed at 70 on 10 Feb 2017. Given the various chart indications, although S&P500 continues to be on an uptrend amid […]