2 interesting charts to take note: Comfort Delgro & Q&M Dental (22 Sep 2021)

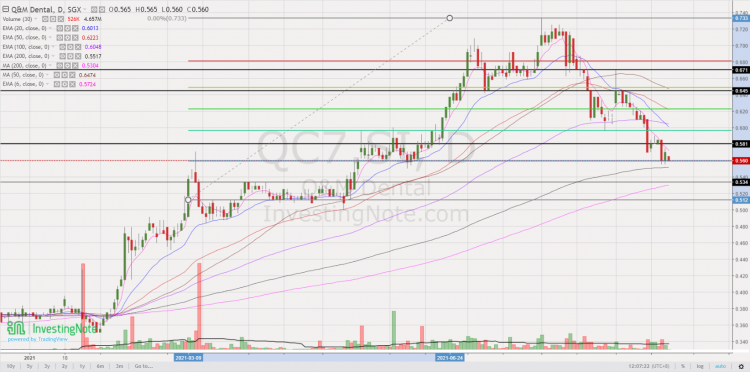
Dear all With reference to my market outlook published on National Day (see HERE), markets have broadly declined, in line with my expectations, with STI and Hang Seng touching their highs on 10 Aug and 11 Aug respectively before dipping. Amid the recent weakness, two stock charts, namely Comfort Delgro and Q&M Dental catch my attention. Let’s take a look.   Comfort Delgro Based on Chart 1 below, Comfort Delgro has retreated to the low last seen in Nov 2020. It is currently at $1.51 and is testing an important support around $1.50-1.51 for the past three days (inclusive today). […]
Recent weakness provides accumulation opportunities (9 Sep 20)

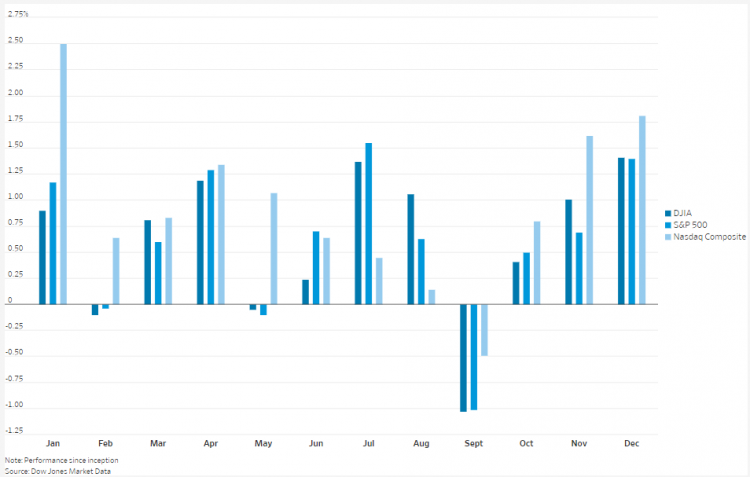
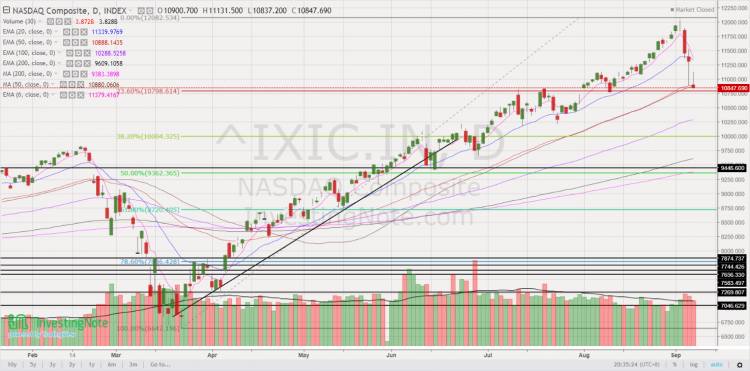
Dear all Based on Table 1 below, U.S. indices have fallen between 5.5% – 10% from the close of 2 Sep to 8 Sep. Nasdaq led the decline with a 10% drop. These are interesting times indeed! Why do I say so? Read on below. Table 1: Performance of various indices from 2 Sep to *8 Sep 20 Source: Ernest’s compilations (*STI and Hang Seng are based on 9 Sep closing prices) In my personal opinion, this recent U.S. market weakness provides accumulation opportunities for the well prepared and for those who have been waiting on the side-lines to accumulate […]

China Everbright Water and NetDragon look interesting… (30 Jul 2020)

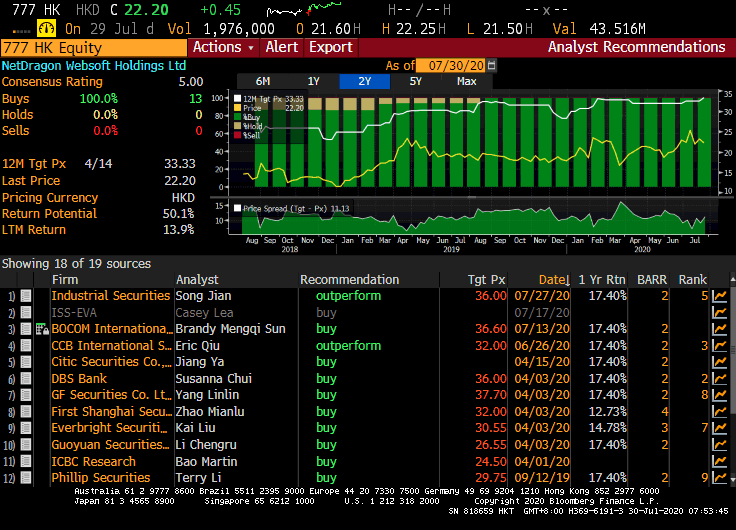
This week, notwithstanding the continuous interest in glove companies, pharmaceutical companies etc, there are some companies which seem to have some steady inflows, based on chart observations. Two companies come to my mind, namely NetDragon and China Everbright Water Limited (“CEWL”). What is so interesting about the above companies? Let’s take a closer look at its chart and other noteworthy points. 1. NetDragon – on an uptrend, with all 13 analysts calling it a BUY Company description – before I delve into the chart… Some readers may not be familiar with NetDragon (HKSE: 0777). According to NetDragon company description, it […]

STI – to head towards 3,390 points in 1Q2020? (25 Dec 19)

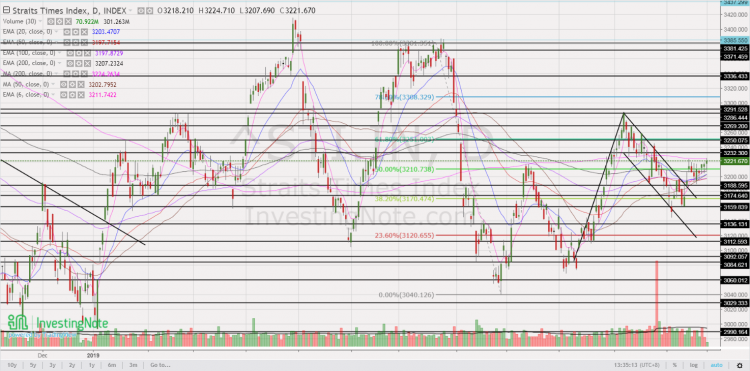
Merry Xmas! As we approach end 2019, most market strategists are putting their market estimates for end 2020. Although I do not profess to be in the league of these market strategists, just for fun, I am expecting STI to head towards 3,390 in 1Q2020. STI closed at 3,222 on 24 Dec 2019. I have outlined my basis and the risks involved.   Factors for my bullish basis a) Chart looks positive after bullish break Based on Chart 1 below, STI has staged a bullish break above its flag formation on 12 Dec 2019. Notwithstanding below average volume for the […]

Nasdaq – potential bearish head and shoulders formation in the making? (29 Sep 19)

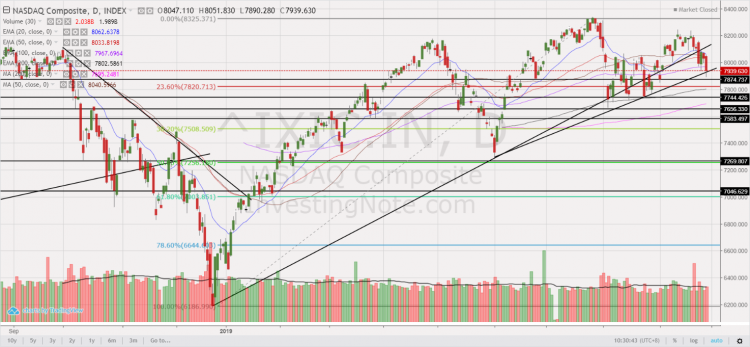
With reference to my earlier write-up (click HERE) titled “S&P500 at 2,979 – limited potential upside (8 Sep 19)”, S&P500 touched intraday highs of 3,021 – 3,022 on 12 Sep 2019 and 19 Sep 2019 but it was still lower than the record intraday high of 3,028 on 26 July 2019. S&P500 closed at 2,962 on 27 Sep 2019. Hang Seng and STI touch one-month intraday highs on 13 Sep 2019 before profit taking sets in. October is likely a volatile month ahead given (just to cite a few examples) more news on trade talks (e.g. U.S vs China; U.S. […]

Hang Seng & STI have fallen close to 2,900 & 250 points in one month! (28 May 19)

Dear readers, Asian markets have fallen quite a bit in the past one month. For example, Hang Seng has fallen close to 2,900 points since touching a high of 30,280 on 15 Apr to trade 27,391 which is the low last seen in January. STI has fallen almost 250 points from an intraday high of 3,415 on 29 Apr to close 3,165 today. Looking at the indices may be deceiving as many shares have fallen a lot. For example, based on Table 1 below, most stocks have fallen at least 10%, with Sembmarine tumbling almost 17% in less than a […]

STI has dropped almost 17% since 2 May! Is a bear market coming? (14 Oct 18)

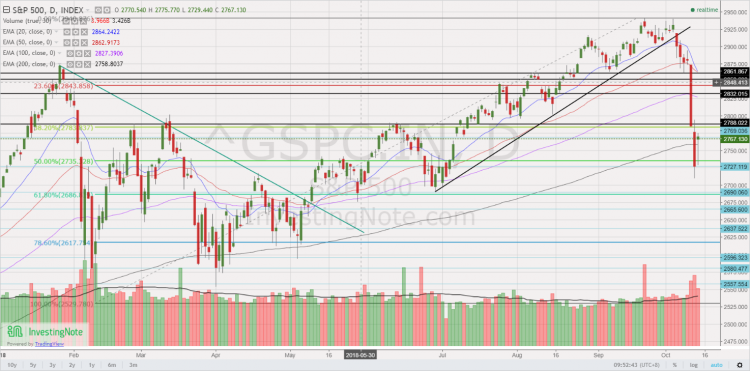
Dear all, U.S. equity markets have logged their worst weekly performance in the past six months. For our local market, STI has dropped 16.7% from an intra-day high of 3,642 on 2 May 2018 to an intra-day low of 3,035 on 11 Oct 2018. It closed at 3,069 on 12 Oct 2018. Is a bear market coming? There are mixed views. Bears are saying that we have not reached the bottom yet. Some perma-bears are even saying this may be the start of the bear market. Bulls are saying that this represents a window of opportunity to accumulate stocks on […]

S&P500, Nasdaq and Russell 2000 hit records, time to switch to underperforming markets? (24 Aug 18)

Dear all, S&P500, Nasdaq and Russell 2000 hit records last Friday with S&P500 closing at 2,875. However, our STI has dropped 11.8% after hitting a decade high of 3,642 on 2 May 2018. Hang Seng has also tumbled 17.4% after hitting a high of 33,484 on 29 Jan 2018. Is this the time to switch out of the U.S. markets and plough it back to STI and Hang Seng? This seems to be the question on most investors’ minds as I am also posed this question during a live interview on Money FM89.3 on last Thursday. Let’s take a closer […]

HK listed China banks to report results this week – potential trading opportunities? (23 Mar 18)

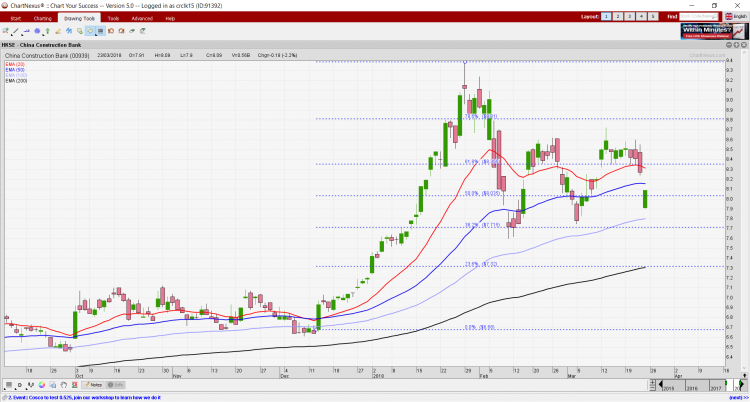
With reference to my earlier write-up (click HERE), besides SGX listed stocks, clients and readers can consider to take a look at some of the China banks listed on HK stock exchange. They may be interesting due to their upcoming results which may present some potential trading opportunities, especially when some of them have fallen 13-14% from their recent highs on 29 Jan 2018.   Why do I choose HK listed China banks, instead of our local banks for potential trading opportunities? 1. On a macro picture, Hang Seng seems to be slightly stronger than STI based on chart. For […]

Global indices have tumbled 6% since their recent high. Will they go lower? (7 Feb 18)

Dear all, With reference to my earlier write-up citing that “Volatility in the market is among the lowest in 118 years…” (click HERE), I guess the old saying is still true. i.e. “Be careful of what one wishes for”, especially in the equity markets! Global indices have recently tumbled at least 6% since their recent high. Will markets fall further?   S&P500 closed at 2,682 S&P500 has swung from an intraday high of 2,873 on 26 Jan 2018 to touch an intraday low of 2,593 on 6 Feb 2018. 20D and 50D exponential moving averages (“EMAs”) are turning downwards. Other […]