Chipotle Mexican Grill reaches all time overbought after an 84% rally in less than 4 months! (1 Apr 19)

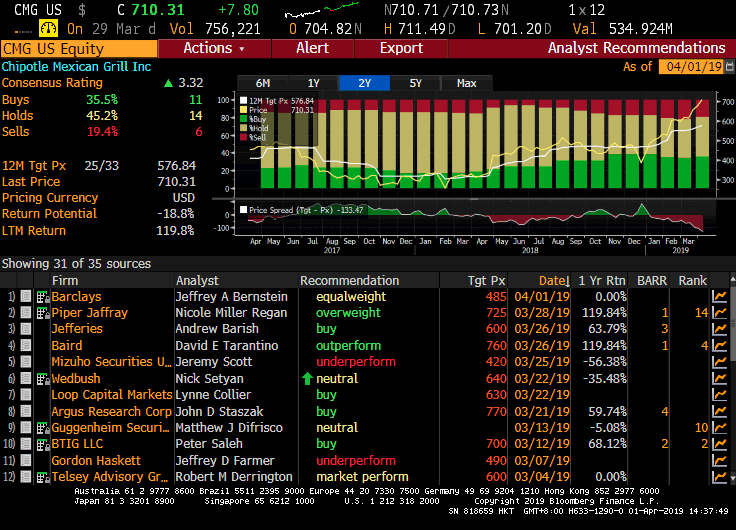
Dear readers, This week, Chipotle Mexican Grill (“Chip”) has caught my attention with its blistering 84% surge since 24 Dec 2018 and its US$100 rally in the past 16 trading days.   First, what does Chip do? Based on Chip’s company website (click HERE), it is an American chain of fast casual restaurants and has nearly 2,500 restaurants as of 31 Dec 2018 in the U.S., Canada, France, Germany and UK. It is the only restaurant company of its size that owns and operates all its restaurants. Its market capitalisation amounts to US$19.6b.   Why is it interesting? Personally, I think […]
S&P500 logged its largest one day fall since Jan. Buy more, or head to the exit? (27 Mar 2019)

Dear readers, Last Fri, S&P500 logged its largest one day fall since 3 Jan 2019, due in part to the weak European PMI and the yield curve inversion between U.S. 3-month bill and 10-year note yields. At the time of writing this, Dow closed 0.55% higher on Tues as U.S. 10 year bond yields stabilise. Is last Fri’s fall the precursor to something more serious? Or it is a false alarm?   First things first, what are the reasons for the sharp rally since late Dec? S&P500 has rallied approximately 20.1%, or 471 points from the intra-day low of 2,347 […]

Hi-P – Chart looks interesting with rising ADX, amid positively placed DI (21 Feb 19)

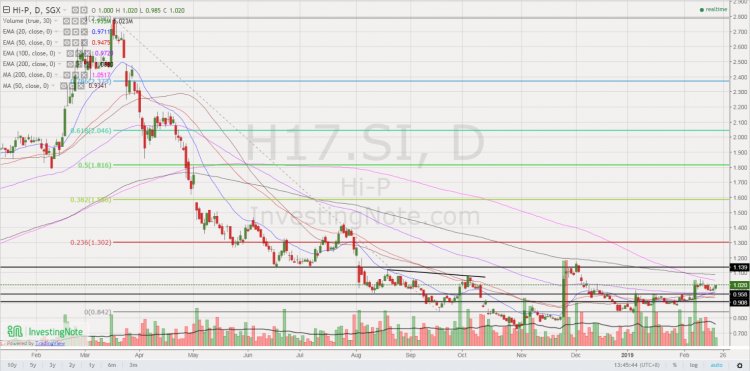
This week, Hi-P caught my attention due to its chart. It last trades at $0.990. Day range 0.985 – 1.00. Let’s take a look. Basis below 1.Chart looks interesting with rising ADX, amid positively placed DI Hi-P has been trading in a tight range $0.885 – 0.960 since 8 Jan 2019 and broke out with strong volume on 11 Feb 2019. ADX has been rising to trade 31.6 amid positively placed DI, indicative of a trend. RSI last trades 57.9. Today is T+8 of 11 Feb upmove. There has been some price weakness on 15 & 18 Feb as I […]

S&P500 has jumped 10.6% since 26 Dec! Should we chase the rally? (12 Jan 2019)

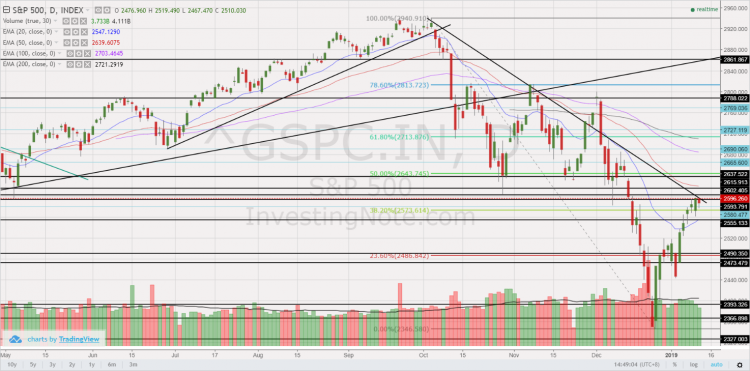
Dear all Since my write-up on 23 Dec 2018 (see HERE), S&P500 has jumped approximately 7.5% since then. In fact, S&P500, after touching an intraday low of 2,347 on 26 Dec 2018, it has risen 249 points or 10.6% to close 2,596 on 11 Jan 2019. Is this the start of another upcycle in equities? Should we chase the rally? Below are some of the positive and negative points which readers can take into consideration before we can arrive to a well thought out answer.   Potential positive points supporting the continuous rally a) Fed may acknowledge rising risks to […]

S&P500 has slumped 13.7% in Dec, largest percentage fall since 1931! Has the bull market ended? (23 Dec 18)

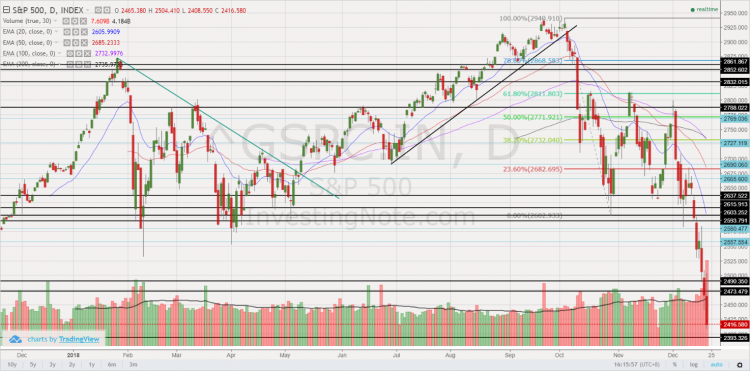
Dear all After hitting an intra-day high of 2,941 on 21 Sep 2018, S&P500 has tumbled 17.9% or 525 points to close 2,416 on 21 Dec 2018. In fact, S&P500 has just logged the worst monthly performance in Dec since 1931! Dow has also fallen 3,535 points from the intraday high of 25,980 on 3 Dec 2018 and 4,507 points from the intraday high of 26,952 on 3 Oct 2018. What is happening? Is Armageddon coming?   Most things have not changed since 21 Sep, except for… In Sep, when S&P500 hit 2,940, the usual concerns were also there, namely […]

S&P500, Nasdaq and Russell 2000 hit records, time to switch to underperforming markets? (24 Aug 18)

Dear all, S&P500, Nasdaq and Russell 2000 hit records last Friday with S&P500 closing at 2,875. However, our STI has dropped 11.8% after hitting a decade high of 3,642 on 2 May 2018. Hang Seng has also tumbled 17.4% after hitting a high of 33,484 on 29 Jan 2018. Is this the time to switch out of the U.S. markets and plough it back to STI and Hang Seng? This seems to be the question on most investors’ minds as I am also posed this question during a live interview on Money FM89.3 on last Thursday. Let’s take a closer […]

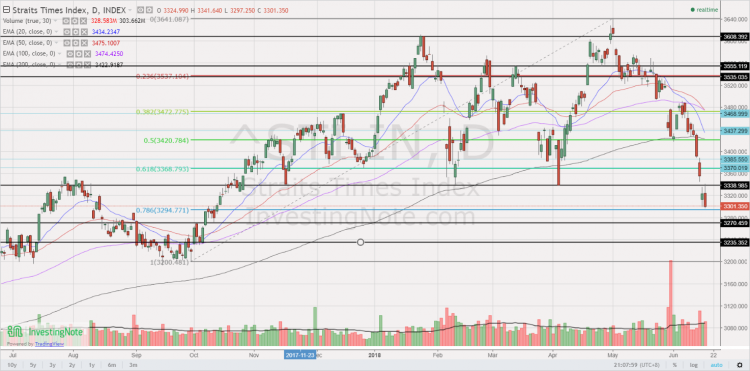
STI – down 9.4% since 2 May. Correction coming, or buying opportunity? (19 Jun 18)

With reference to my market outlook HERE posted on 11 May 2018, I mentioned at that time that I  have started to sell into strength, as I am cautious on the overall market. I updated on 30 May 2018 (click HERE) that STI is likely to trade sideways with downward bias. Separately, my clients would have been notified on 12 Jun 2018 morning that I have already reduced my percentage invested to approximately 40% as I believe market is likely to trend downwards in the next couple of weeks. In the span of four trading days, STI has dropped 148 […]

STI slumps 198 points after hitting a decade high of 3,642 on 2 May! (30 May 18)

With reference to my market outlook HERE posted on 11 May 2018, I mentioned at that time that I have started to sell into strength, as I am cautious on the overall market. Clients would have been aware / notified that I have already reduced my percentage invested to <60% early last week. STI has since dropped 126 points from 3,570 on 11 May 2018 to close 3,444 on 30 May 2018. For those who wish to accumulate on weakness, I have compiled a list of stocks here, using Bloomberg’s data as of 30 May 2018. The criteria for compilation […]

STI notched a ten year high on 2 May – is it a screaming buy for all SG stocks (11 May 18)

Dear all, Dow has logged a seventh consecutive rise and small caps as measured by S&P600 index have just closed at a record high as of 11 May 2018. Our Singapore market has also done us proud too by becoming Asia’s best performing equity market on 2 May 2018. In view of the above, is it a screaming buy for our Singapore market, especially our small caps which have under-performed? Let’s take a closer look at the charts and my personal action plan.   S&P500 closed 2,728. Day range 2,717 – 2,733 Based on Chart 1 below, S&P500 seems to […]

Venture approaches bear territory! Should we sell? (24 Apr 18)

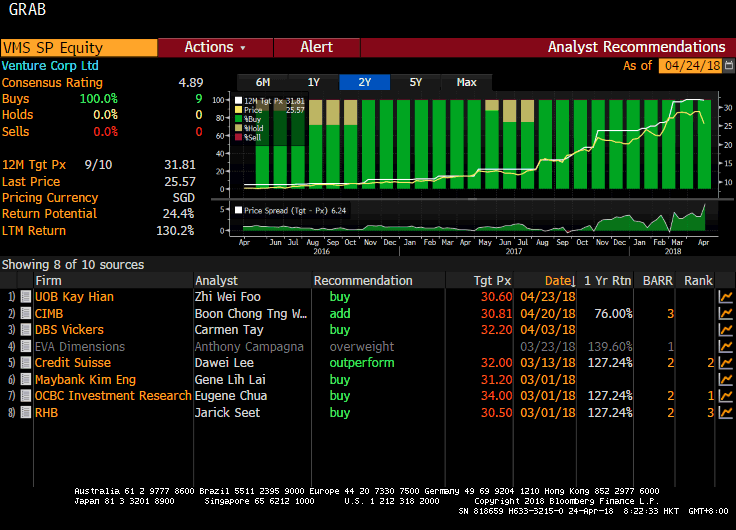
Dear all, Venture has entered into bear territory after dropping 21% from an intraday high of $29.65 on 13 Apr 2018 to close $23.40 on 24 Apr 2018. What should we do? Let’s examine the chart and some noteworthy points on Venture.   Chart analysis Based on Chart 1 below, Venture’s chart seems to resemble a bearish double top formation. The break below its neckline $26.95 points to an eventual technical measured target $24.60 which is already attained today. 20D, 50D and 100D exponential moving averages (“EMA”) have started to turn lower amid the sharp drop. Venture closed below its […]