Recent weakness provides accumulation opportunities (9 Sep 20)

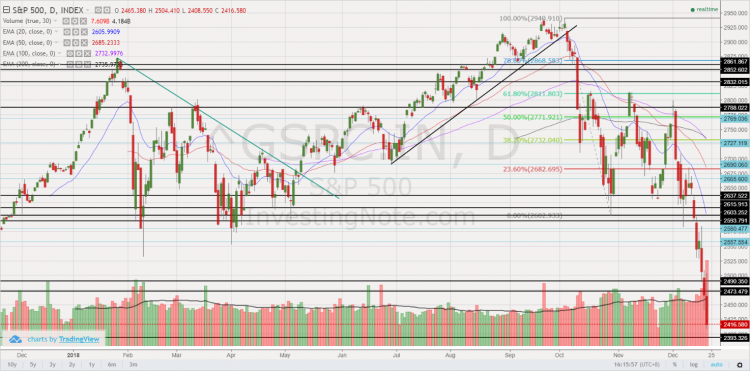
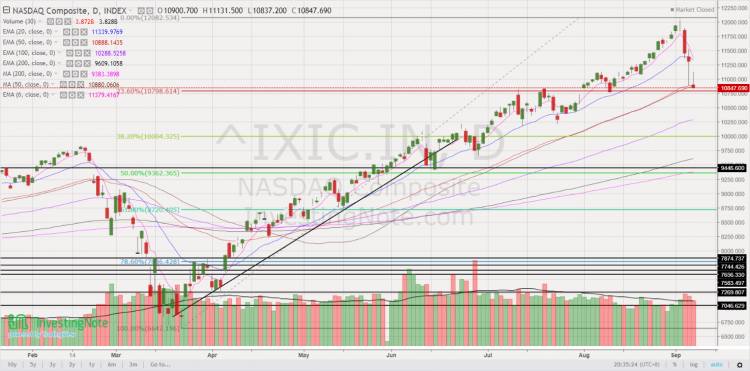
Dear all Based on Table 1 below, U.S. indices have fallen between 5.5% – 10% from the close of 2 Sep to 8 Sep. Nasdaq led the decline with a 10% drop. These are interesting times indeed! Why do I say so? Read on below. Table 1: Performance of various indices from 2 Sep to *8 Sep 20 Source: Ernest’s compilations (*STI and Hang Seng are based on 9 Sep closing prices) In my personal opinion, this recent U.S. market weakness provides accumulation opportunities for the well prepared and for those who have been waiting on the side-lines to accumulate […]

Stocks sorted by total potential return (7 Sep 2020)

Dear all U.S. markets have fallen sharply with Nasdaq dropping almost 1,200 points or 10% from an intraday high of 12,074 on 2 Sep to an intraday low of 10,876 last Fri. For example, Apple Inc. has lost $219b in market cap from the close of 1 Sep through 3 Sep which is larger than the market cap of Exxon Mobil Corp., for long the world’s largest company! In view of the recent decline, some clients have asked me which are the stocks that they can look at. Below is my compilation of the top ten stocks and the bottom […]

ARA HTrust – most oversold stock in Singapore with 10% estimated div yield (5 Mar 2020)

Dear all, Yesterday evening, as I run my stock screening via Bloomberg, ARA HTrust comes out to be the most oversold among Singapore listed stocks yesterday with a RSI of 8.2. This is its most oversold level since listing. ARA HTrust has tumbled approximately 22% from an intraday high of US$0.900 to close at US$0.705 yesterday, which is the lowest close since IPO. Why does it attract my attention? Read on for more.   A) Chart – Selling pressures may ease as oversold pressures escalate Based on Chart 1 below, ARA HTrust is entrenched in a downtrend. All the exponential […]

Singpost – grossly oversold; closes at prices last seen in May 2009! (2 Mar 2020)

Dear all, It has been an extremely busy and hectic period with the U.S. indices clocking in their largest record weekly percentage drop last week. This week, Singpost caught my attention. Singpost has fallen 17.4% from its intraday high of $0.950 on 3 Jan 2020 to close at $0.785 today which is the lowest close since 5 May 2009. RSI closes at a grossly oversold level 10.7, almost at an all-time low last seen in June 2003. Why does it attract my attention? Read on for more.   Chart – Seems to indicate selling pressures may ease in the near […]

China Aviation – chart looks bullish amid analyst buy calls; below average valuations, supported with 3.6% dividend yield (3 Jan 2020)

Dear readers, Happy New Year! Hope your new year has been great. Market has been extremely interesting for the past couple of months. Recently, China Aviation (“CAO”) caught my attention with its bullish chart and looks interesting on a risk to reward aspect. CAO closed at $1.30 last Fri. Day range was $1.29-1.32. Read on for more.   Why did CAO catch my attention? a) Average analyst target price $1.70 With reference to Figure 1 below, average analyst target is around $1.70. Together with an estimated dividend yield of around 3.6%, CAO offers a total potential return of around 34%. […]

STI – to head towards 3,390 points in 1Q2020? (25 Dec 19)

Merry Xmas! As we approach end 2019, most market strategists are putting their market estimates for end 2020. Although I do not profess to be in the league of these market strategists, just for fun, I am expecting STI to head towards 3,390 in 1Q2020. STI closed at 3,222 on 24 Dec 2019. I have outlined my basis and the risks involved.   Factors for my bullish basis a) Chart looks positive after bullish break Based on Chart 1 below, STI has staged a bullish break above its flag formation on 12 Dec 2019. Notwithstanding below average volume for the […]

HRNet – All time oversold levels amid lowest price since IPO! (29 Aug 19)

Dear all Another exciting week! This week, HRNet caught my attention as it approaches all time oversold RSI level. In addition, it is trading at the lowest price $0.560 since its IPO price at $0.900. Given the basis below, my personal view is that HRNet may be presenting a favourable risk reward setup for a long trade. Do look at the basis and more importantly, the risks inherent in such trades.   My personal basis a) Average target price $0.93! Based on Figure 1 below, average analyst target is around $0.930, representing a potential capital upside 66%. Estimated div yield […]

CKH Holdings at 19-year oversold levels; multi-year low price amid 10-year low valuations (6 Aug 19)

Dear all What a hectic and exciting week! This week, CKH Holdings (00001.HK) (“CKH”) caught my attention with its 19-year low RSI level since end Dec 2000. At the time of writing this, CKH last trades at HKD67.60, level last seen around 21 Feb 2014. With such a precipitous decline, CKH is trading below its 10-year average valuations. Given the basis below, my personal view is that CKH may be presenting a favourable risk reward setup for a long trade. Do take a look at the basis and more importantly, the risks inherent in such trades.   My personal basis […]

Halliburton trades at 9-year low price, amid 10-year low valuations (17 Jun 19)

Dear all This week, Halliburton (“HAL”) caught my attention as it closed at US$21.38 on 14 Jun 2019, lowest since 1 Jun 2010 and 7 Aug 2009, amid 10-year low valuations. Given the basis below, my personal view is that HAL may be presenting a favourable risk reward setup for a long trade.   Potential basis to long a)  At US$21.38, this is the lowest close since 1 Jun 2010. At 12.5x current PE and 1.9x P/BV (see Figure 1 below), these valuations seem attractive as compared to its 10Y average PE and P/BV 29.3x and 3.2x respectively; Figure 1: […]

S&P500 has slumped 13.7% in Dec, largest percentage fall since 1931! Has the bull market ended? (23 Dec 18)

Dear all After hitting an intra-day high of 2,941 on 21 Sep 2018, S&P500 has tumbled 17.9% or 525 points to close 2,416 on 21 Dec 2018. In fact, S&P500 has just logged the worst monthly performance in Dec since 1931! Dow has also fallen 3,535 points from the intraday high of 25,980 on 3 Dec 2018 and 4,507 points from the intraday high of 26,952 on 3 Oct 2018. What is happening? Is Armageddon coming?   Most things have not changed since 21 Sep, except for… In Sep, when S&P500 hit 2,940, the usual concerns were also there, namely […]