Will Singapore stocks outperform U.S. stocks in 2022? (5 Jan 2022)

Dear all With reference to my market outlook published on 7 Nov (see HERE) citing our Singapore market may face near term profit taking, STI dropped 201 points, or 6.6% from 3,242 on 5 Nov to close at 3,041 on 30 Nov. As we start 2022, various investment banks and research houses have put forth their views on how the various markets will perform. In this write-up, I will share how the markets have performed in 2021 and my market outlook in 2022.   How did the markets perform in 2021? Based on Table 1 below, it is evident that […]
STI – having closed at a record YTD high, will it continue higher? (7 Nov 2021)

Dear all With reference to my market outlook published on 3 Oct (see HERE) citing opportunities in our Singapore market, STI has soared 191 points, or 6.3% from 3,051 on 1 Oct to close at a year to date high 3,242 on 5 Nov. Will STI continue to march higher, or will there be some profit taking?   Very briefly, my personal view is It is likely that STI may face some profit taking in the near term, attributable in part to the following factors: a) With reference to Figure 1 below, MSCI Singapore index will undergo a rebalancing in […]

3 interesting charts to take note: GSS Energy, China Sunsine and Sing Medical (28 Oct 2021)

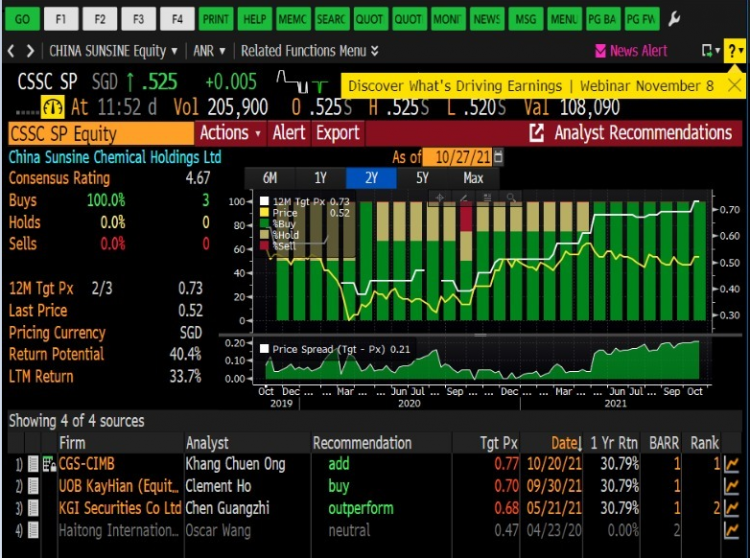
Dear all With reference to my market outlook published on 3 Oct 2021 (see HERE) where I cited opportunities in our Singapore market, our Singapore market (represented by STI) has jumped 154 points, or 5.1% since 1 Oct. Amid the recent strength, is it too late to plough into the markets? Are there still stocks who may have further upside? Based on my personal chart observation, GSS Energy, China Sunsine and Sing Medical have interesting / bullish charts’ setups which may be interesting to take a look.   GSS Energy Based on Chart 1 below, GSS seems to be on […]

S&P500 closed at record high! What should we do? Buy or sell? (9 Aug 2021)

Dear all S&P500 has clocked its sixth consecutive month of gains in July 2021. This is the longest stretch since 2018. Furthermore, S&P500 has touched a record high to close at 4,437 on 6 Aug 2021. In the next 3 months, are markets poised for higher highs? Or should we be prudent and take some profit off the table first? Let’s take a look.   Ernest’s personal market observations a) Lack of catalysts to push the market higher Since Covid last year, markets, especially U.S. markets, have been able to push higher due partly to the combination of ultra-easy monetary policies; […]

China Aoyuan – a potential value play? (15 Jun 21)

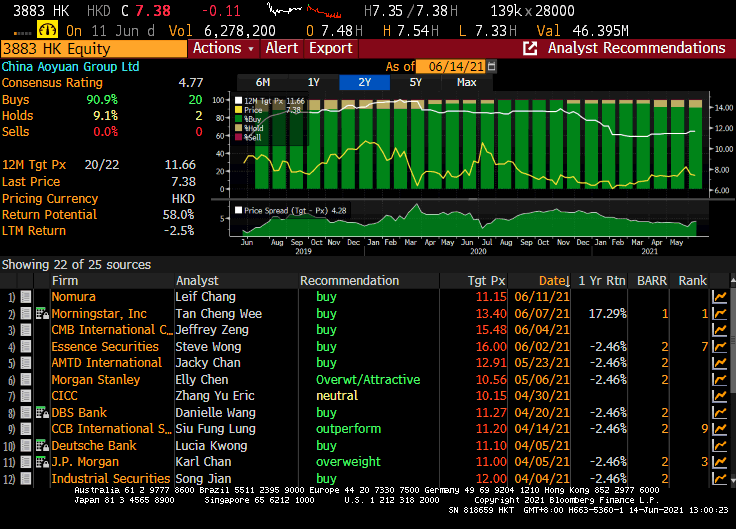
Dear all Against the backdrop of rising inflation, some market strategists have recommended “additional urgency” to rotate from technology plays to “old economy value stocks” to hedge against potential inflation pressures (as they believe such inflation pressures are not transitory). A stock that may tick all the right boxes may be China Aoyuan (“Aoyuan”) (3883.HK). It belongs to the old economy stocks (i.e. property sector which may be a hedge against inflation) and seems to be a value play, given that it trades at HKD7.01 on 15 Jun 21.   Who is Aoyuan? Quoting from a report by DBS Research […]

Singapore – Asia’s worst equity market YTD, any opportunities ahead? (29 Oct 20)

Dear all It is less than a week from the U.S. election. U.S. markets are understandably jittery. S&P500 has fallen 316 points, or 8.9% from its intraday high of 3,550 on 12 Oct 2020 to touch an intraday low 3,234 on 30 Oct 20. In fact, S&P500 has tumbled 195 points or 5.6% this week. S&P500 closed at 3,270 on 30 Oct. The media has written extensively on the risks surrounding U.S. election since months ago hence the election event risk is hardly a new one. Examples of risks which media has written about is the possibility on contested election […]

China Railway Construction (01186.HK) – Bargain buy, or value trap? (22 Sep 2020)

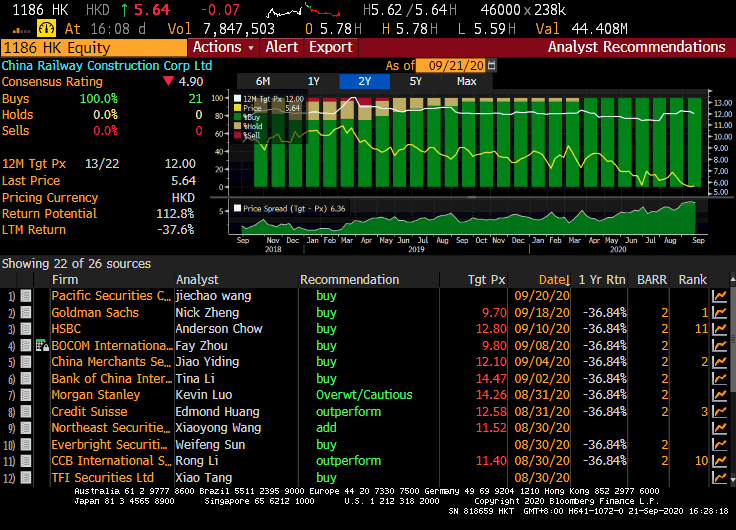
China Railway Construction (“CRCC”) recently caught my attention as it has tumbled approximately 44% from an intraday high of $9.99 on 5 Mar 2020 to close HKD5.64 on 21 Sep 2020. Is this a bargain buy, or a value trap? Let’s take a look.   First up, a description of CRCC Quoting from its 1HFY20 results, CRCC’s businesses cover a variety of construction, survey, design and consultation, manufacturing, real estate development, logistics and materials trading and other business with refined industry chain covering scientific research, planning, survey, design, construction, supervision and management, maintenance, operation, investment and financing, etc.   Six […]

Stocks sorted by total potential return (7 Sep 2020)

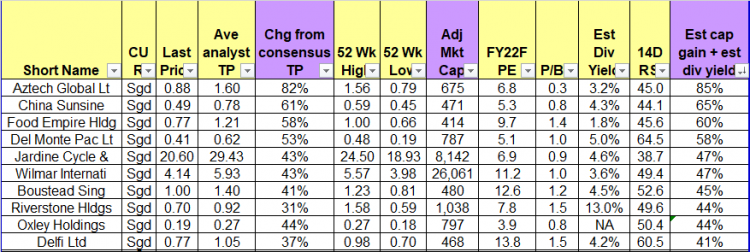
Dear all U.S. markets have fallen sharply with Nasdaq dropping almost 1,200 points or 10% from an intraday high of 12,074 on 2 Sep to an intraday low of 10,876 last Fri. For example, Apple Inc. has lost $219b in market cap from the close of 1 Sep through 3 Sep which is larger than the market cap of Exxon Mobil Corp., for long the world’s largest company! In view of the recent decline, some clients have asked me which are the stocks that they can look at. Below is my compilation of the top ten stocks and the bottom […]

China Everbright Water and NetDragon look interesting… (30 Jul 2020)

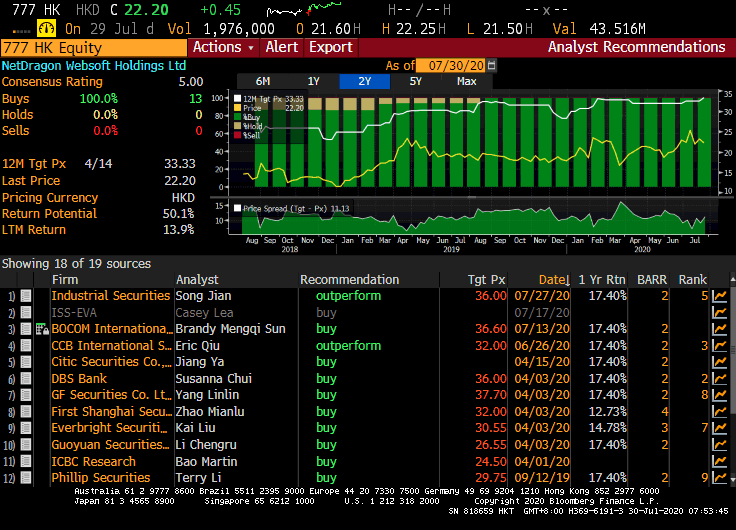
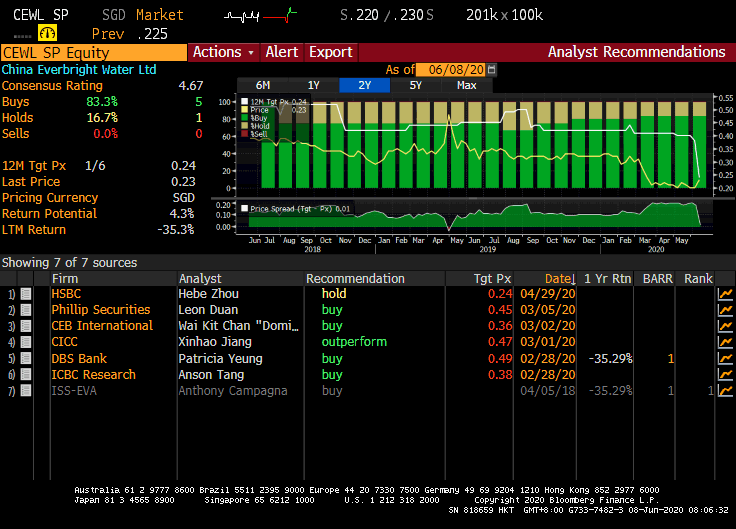
This week, notwithstanding the continuous interest in glove companies, pharmaceutical companies etc, there are some companies which seem to have some steady inflows, based on chart observations. Two companies come to my mind, namely NetDragon and China Everbright Water Limited (“CEWL”). What is so interesting about the above companies? Let’s take a closer look at its chart and other noteworthy points. 1. NetDragon – on an uptrend, with all 13 analysts calling it a BUY Company description – before I delve into the chart… Some readers may not be familiar with NetDragon (HKSE: 0777). According to NetDragon company description, it […]

China Everbright Water – bullish break above trading range (10 Jun 2020)

This week, China Everbright Water Limited (“CEWL”) catches my attention this week. Since 17 Mar 2020, CEWL has been trading sideways from $0.200 – 0.230. Based on chart, CEWL seems to be on the verge of a breakout. It last trades at $0.235. What is so interesting about CEWL? Let’s take a closer look at its chart and other noteworthy points.   CEWL – Broke out of 2+ month trading range with volume expansion Bullish chart underpinned by rising EMAs and volume Based on Chart 1 below, since 17 Mar 2020, CEWL has been trading sideways from $0.200 – 0.230. […]